In short
- Open the dashboard on the decisions owed, before any status tile.
- Show plan, actual and forecast side by side, so every gap has a direction.
- Give each seat its own view, drawn from one model, so the numbers agree.
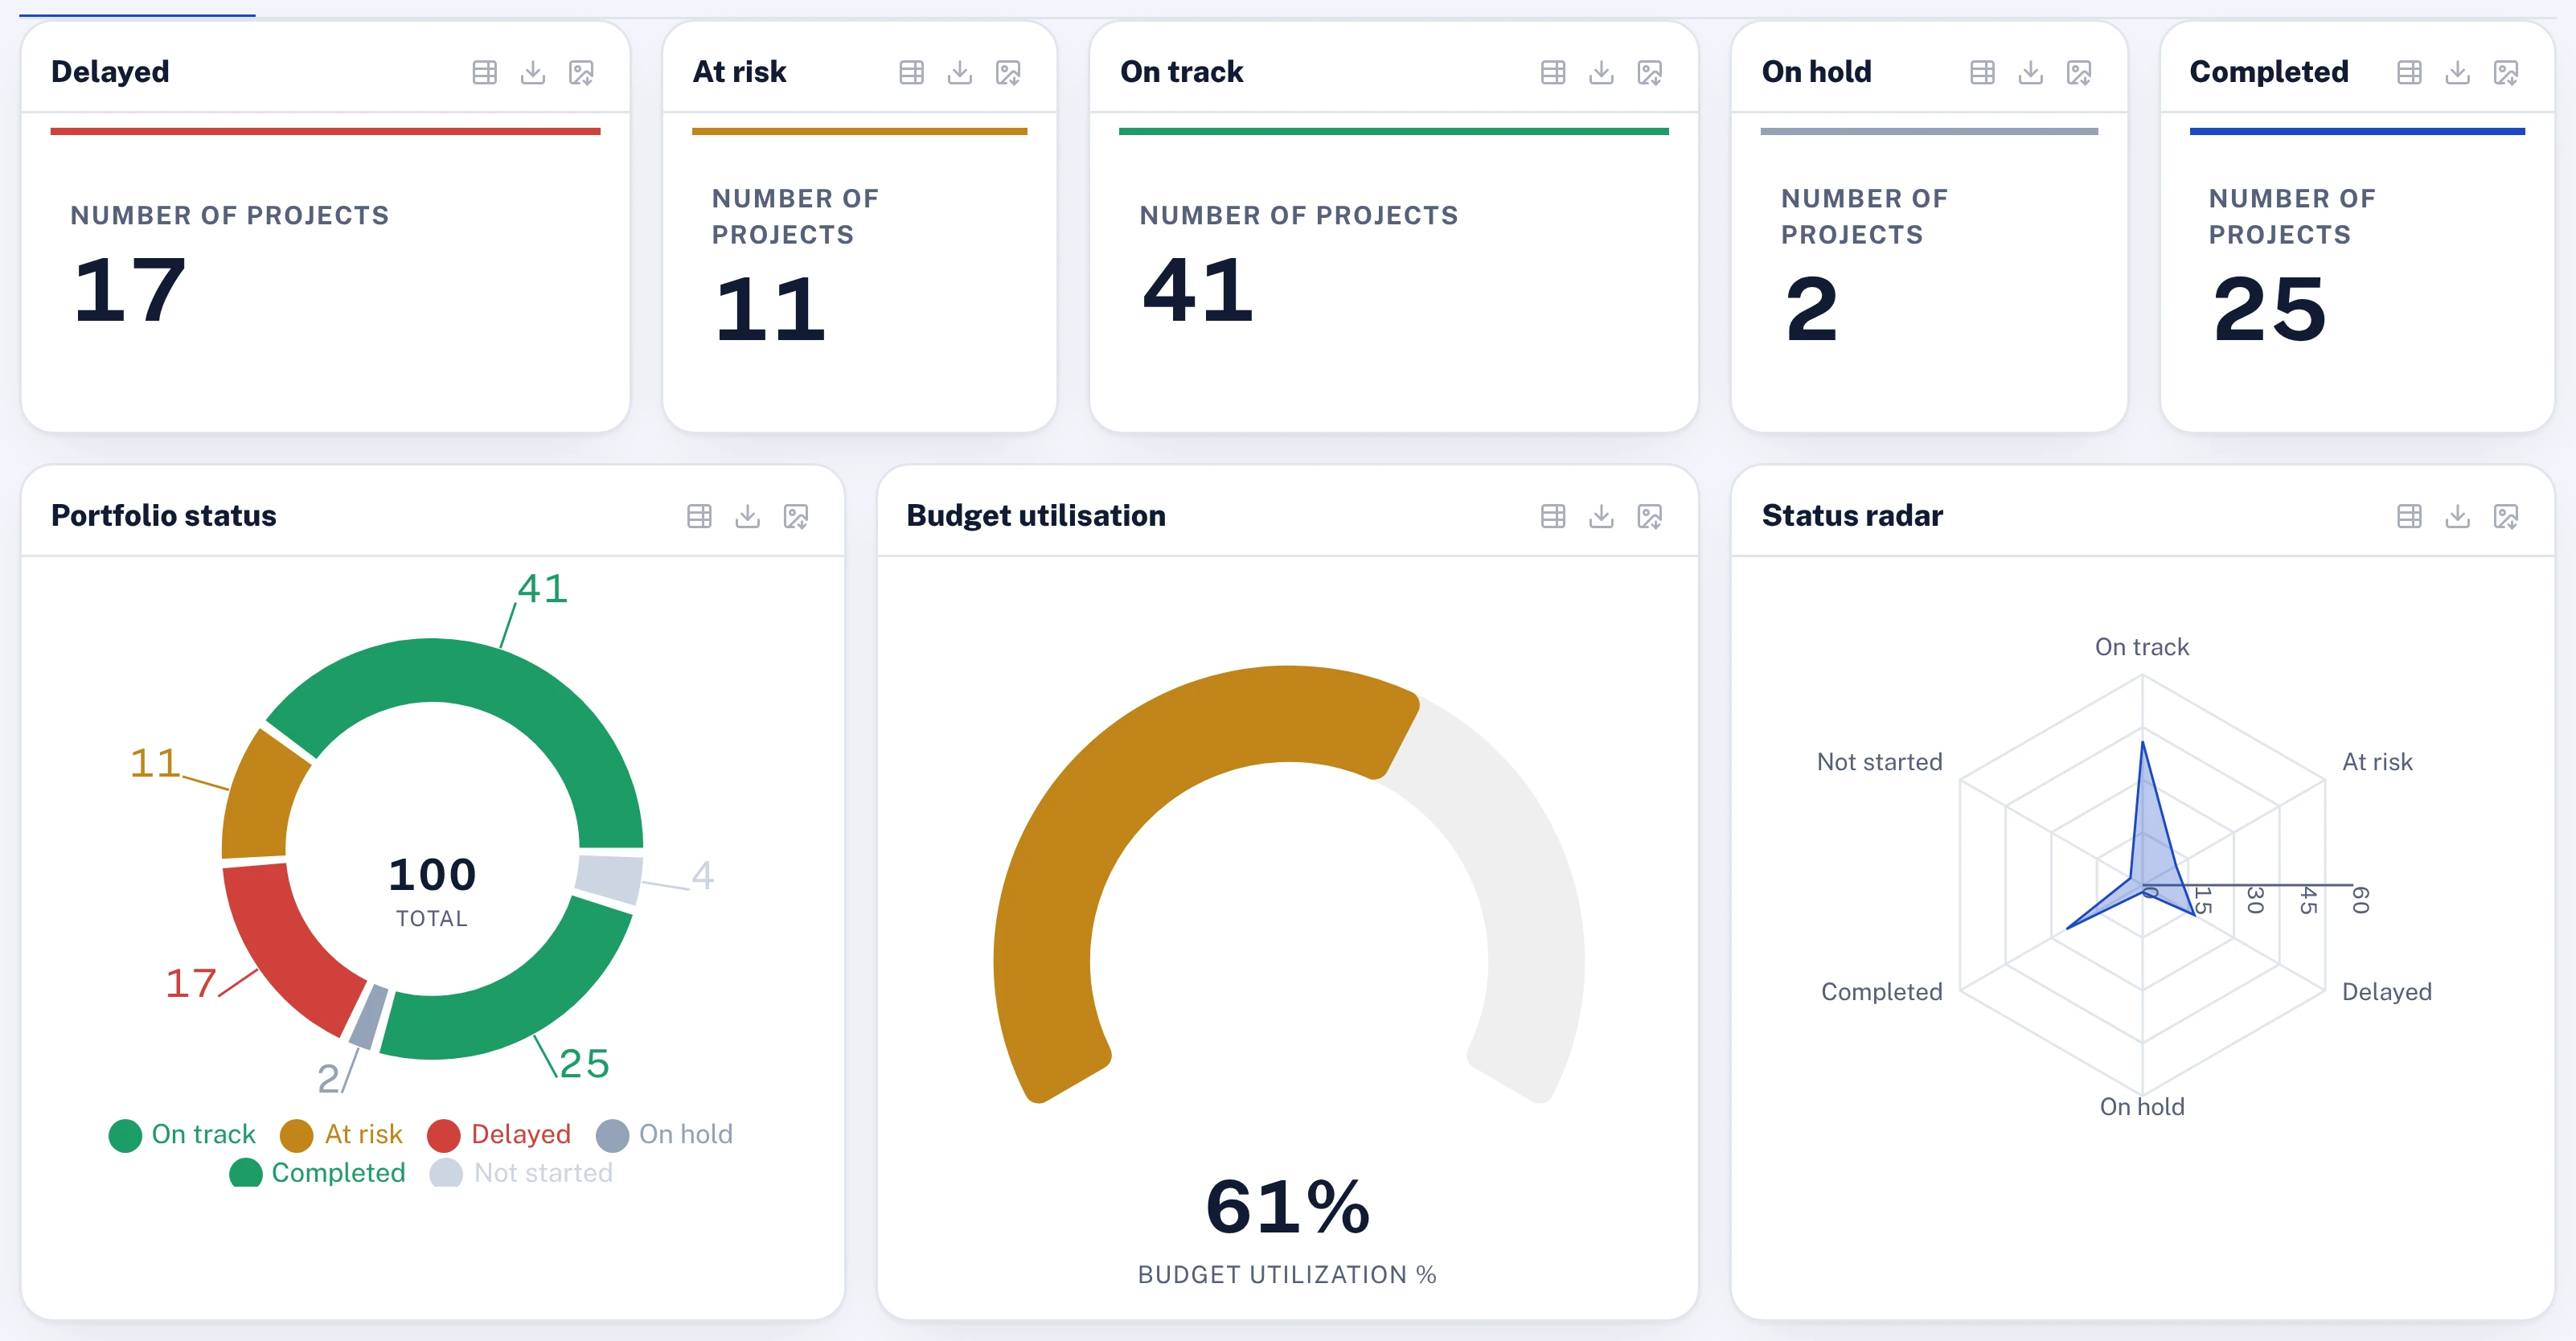
The executive committee meets on the first Monday of the month. On the screen is the PMO dashboard: sixty project tiles in a grid, each red, amber or green, with a donut of the same colours in the corner. The chief executive looks at it for half a minute, asks about the two reds, and moves to the next item.
The following week the finance committee sees its own dashboard, built by finance from the budget system. The transformation steering committee sees a third, built by the transformation office. All three report on the same programme. They give three figures for progress and two for spend.
Nobody in any of those meetings decided anything because of a tile.
What goes wrong with the PMO dashboard
A PMO dashboard is meant to help the people who run the organisation act on its portfolio. In the programmes I have worked in, most are built instead to show that every project has been looked at. Four faults follow from that, and each one makes the screen easier to read and harder to act on.
It shows status and asks for nothing. A grid of tiles answers how things are going. The executive's real question is what the PMO needs from them. The dashboard has no place for the answer: the change request waiting for approval, the funding release, the clash between two initiatives that only the committee can settle. Those sit in an inbox, and the dashboard looks calm.
Colour has no direction. A tile shows where a project is today against its plan. It does not show where the project will land, or whether the gap is closing. An amber that is recovering and an amber that is sliding look identical, and only one of them needs the committee.
The colour is typed in. The status behind each tile is what its owner picked on Wednesday. The dashboard aggregates those choices into a chart, and a donut makes a set of opinions look like a measurement.
Every forum builds its own. Because the PMO dashboard does not answer finance's question or the board's, each forum builds its own from its own extract, taken on a different day. The numbers disagree, and the first part of every meeting goes on reconciling them.
The result is a dashboard that is reviewed every month and rarely acted on. Executives learn to ask the head of the PMO directly, which is the dashboard's job done by hand.
What a good executive dashboard shows
The moves below apply whether the screen is called a project portfolio dashboard in a ministry or a programme dashboard in a utility, which American readers will know as a program dashboard. None of them needs a particular tool to begin.
Open on the decisions owed
The first thing on the screen is what the viewer is being asked to decide: approvals waiting on them, sponsor support requested, decisions pending in a forum, each with its age. Status comes second, as the context for those decisions. A dashboard that opens on a grid of tiles teaches its readers to look for red. One that opens on decisions teaches them to act.
In Lodestar, the home page can carry a "Needs your decision" panel holding the approvals queue, such as change requests and sign-offs, and the PMO queue counts pending decisions and approvals, open actions, missing weekly updates and milestones due, each tile opening the list behind it.
Show plan, actual and forecast together
For every headline figure, show three numbers: what the plan said by now, what has happened, and where it is forecast to land. That holds for progress against plan, spend against budget and each KPI against its target. The gap between actual and plan tells the executive where the programme stands. The forecast tells them whether it is getting better, and that is the part they can still change.
In Lodestar, each KPI keeps its plan, actual and forecast as separate figures, and the executive dashboard's KPI outlook shows where every KPI is forecast to land at year-end next to its status today, with the largest gaps between the owner's forecast and the trend.
Count only status that evidence supports
A dashboard is only as honest as the figures under it. Progress should count work accepted by someone other than the person who did it, and hold claimed but unapproved work just short of complete. Flag the greens with no report behind them. The executive may see more amber at first. It will be amber they can believe, and I set out why in Green, and wrong.
In Lodestar, an activity claimed at 100% counts as 95% in every roll-up until someone other than its owner approves the evidence, so the dashboard shows approved progress. Detectors flag greens with no reports behind them.
Let every number open down to the work
A figure the board sees should open, in a few clicks, into the pillar, the initiative, the project and the activity behind it. When a director asks why a pillar is behind, the answer is on the screen in the meeting, not a promise to come back next month.
In Lodestar, the programme timeline drills from pillar to initiative to project and its activities, and any widget on a custom dashboard opens the rows underneath it.
Give each seat its own view of one model
The board, the executive committee, the finance committee and the PMO need different screens. They should not need different numbers. Build each view from the same records and the same calculation, and produce the board pack from that model too, so the pack and the dashboard cannot disagree. I made the same case for the pack in Board packs that help directors govern.
In Lodestar, a dashboard can be personal, shared with a department or a role, or published to the workspace, starting from seven templates such as Executive PMO, Delivery Operations and Project cockpit, and every widget reads the live model within the viewer's own permissions. The strategy progress report, the KPI scorecard and the project deep dives are generated from the same model.
Questions for your next review
- What decisions are waiting on this committee today, and where does the dashboard show them?
- For the ten largest projects, what is the forecast, and is the gap to plan closing or widening?
- How much of the progress on this screen has been approved by someone other than its owner?
- Which figures on this dashboard differ from the board pack and the finance report, and why?
- From the board's headline number, how many clicks does it take to reach the activity behind it?
A dashboard earns its place on the screen when someone leaves the meeting having decided something because of it. Put the decisions first and one model underneath, and the tiles become the evidence for those decisions instead of the subject of the meeting.

Hany is a strategy and transformation executive with a technical background in software and AI. He has advised C-suites at a top-three strategy consulting firm (MBB) and independently, and has run transformation programmes of more than USD 1 billion.
Connect on LinkedIn