Cost and schedule health for every project, without a spreadsheet
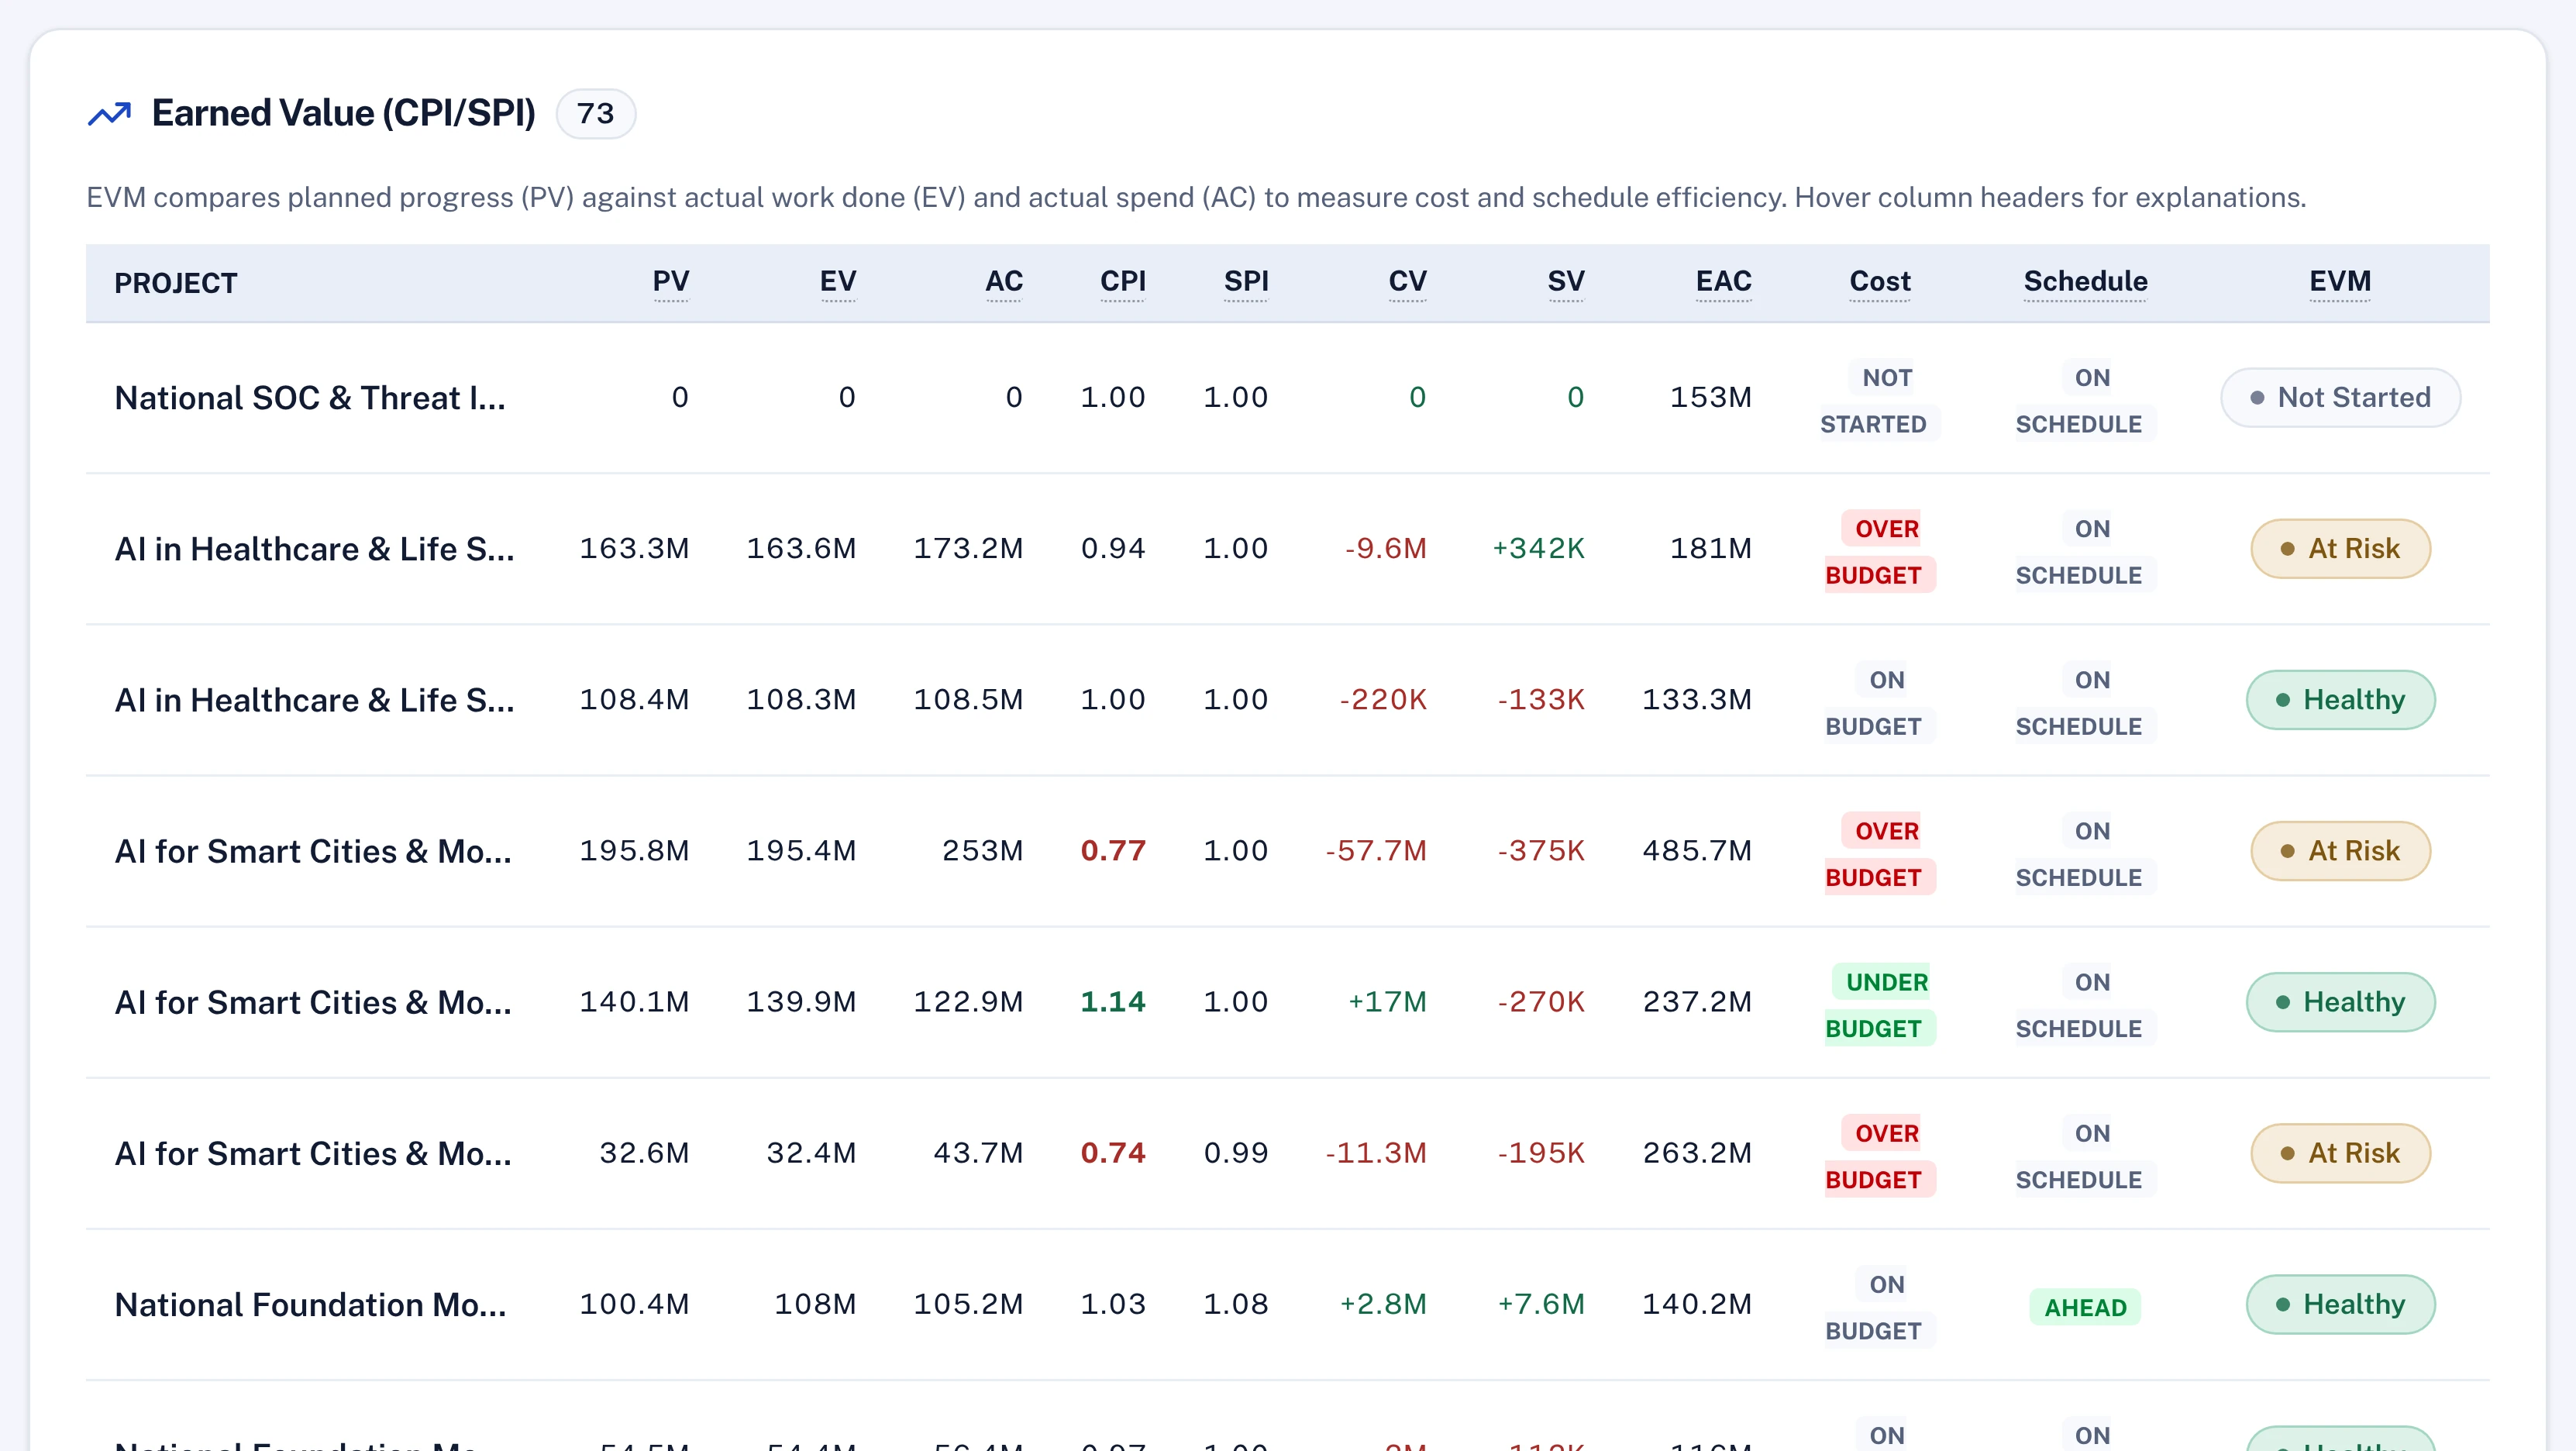
Earned value compares three numbers: what the plan said should be done by now, what has been done, and what it has cost. Lodestar computes them for every active project with a budget and dates, from the same schedule, approvals and spend the rest of the platform uses.
What usually goes wrong
And what changes when it runs on one model.
Earned value lives in a spreadsheet
One analyst rebuilds it each month from exports that are already out of date.
Progress is whatever was typed
Earned value built on self-reported completion flatters every project.
Spend arrives late
Actual cost is copied from the finance system weeks after the money left.
A red index leads nowhere
The report shows a CPI of 0.8 and nobody can open the work behind it.
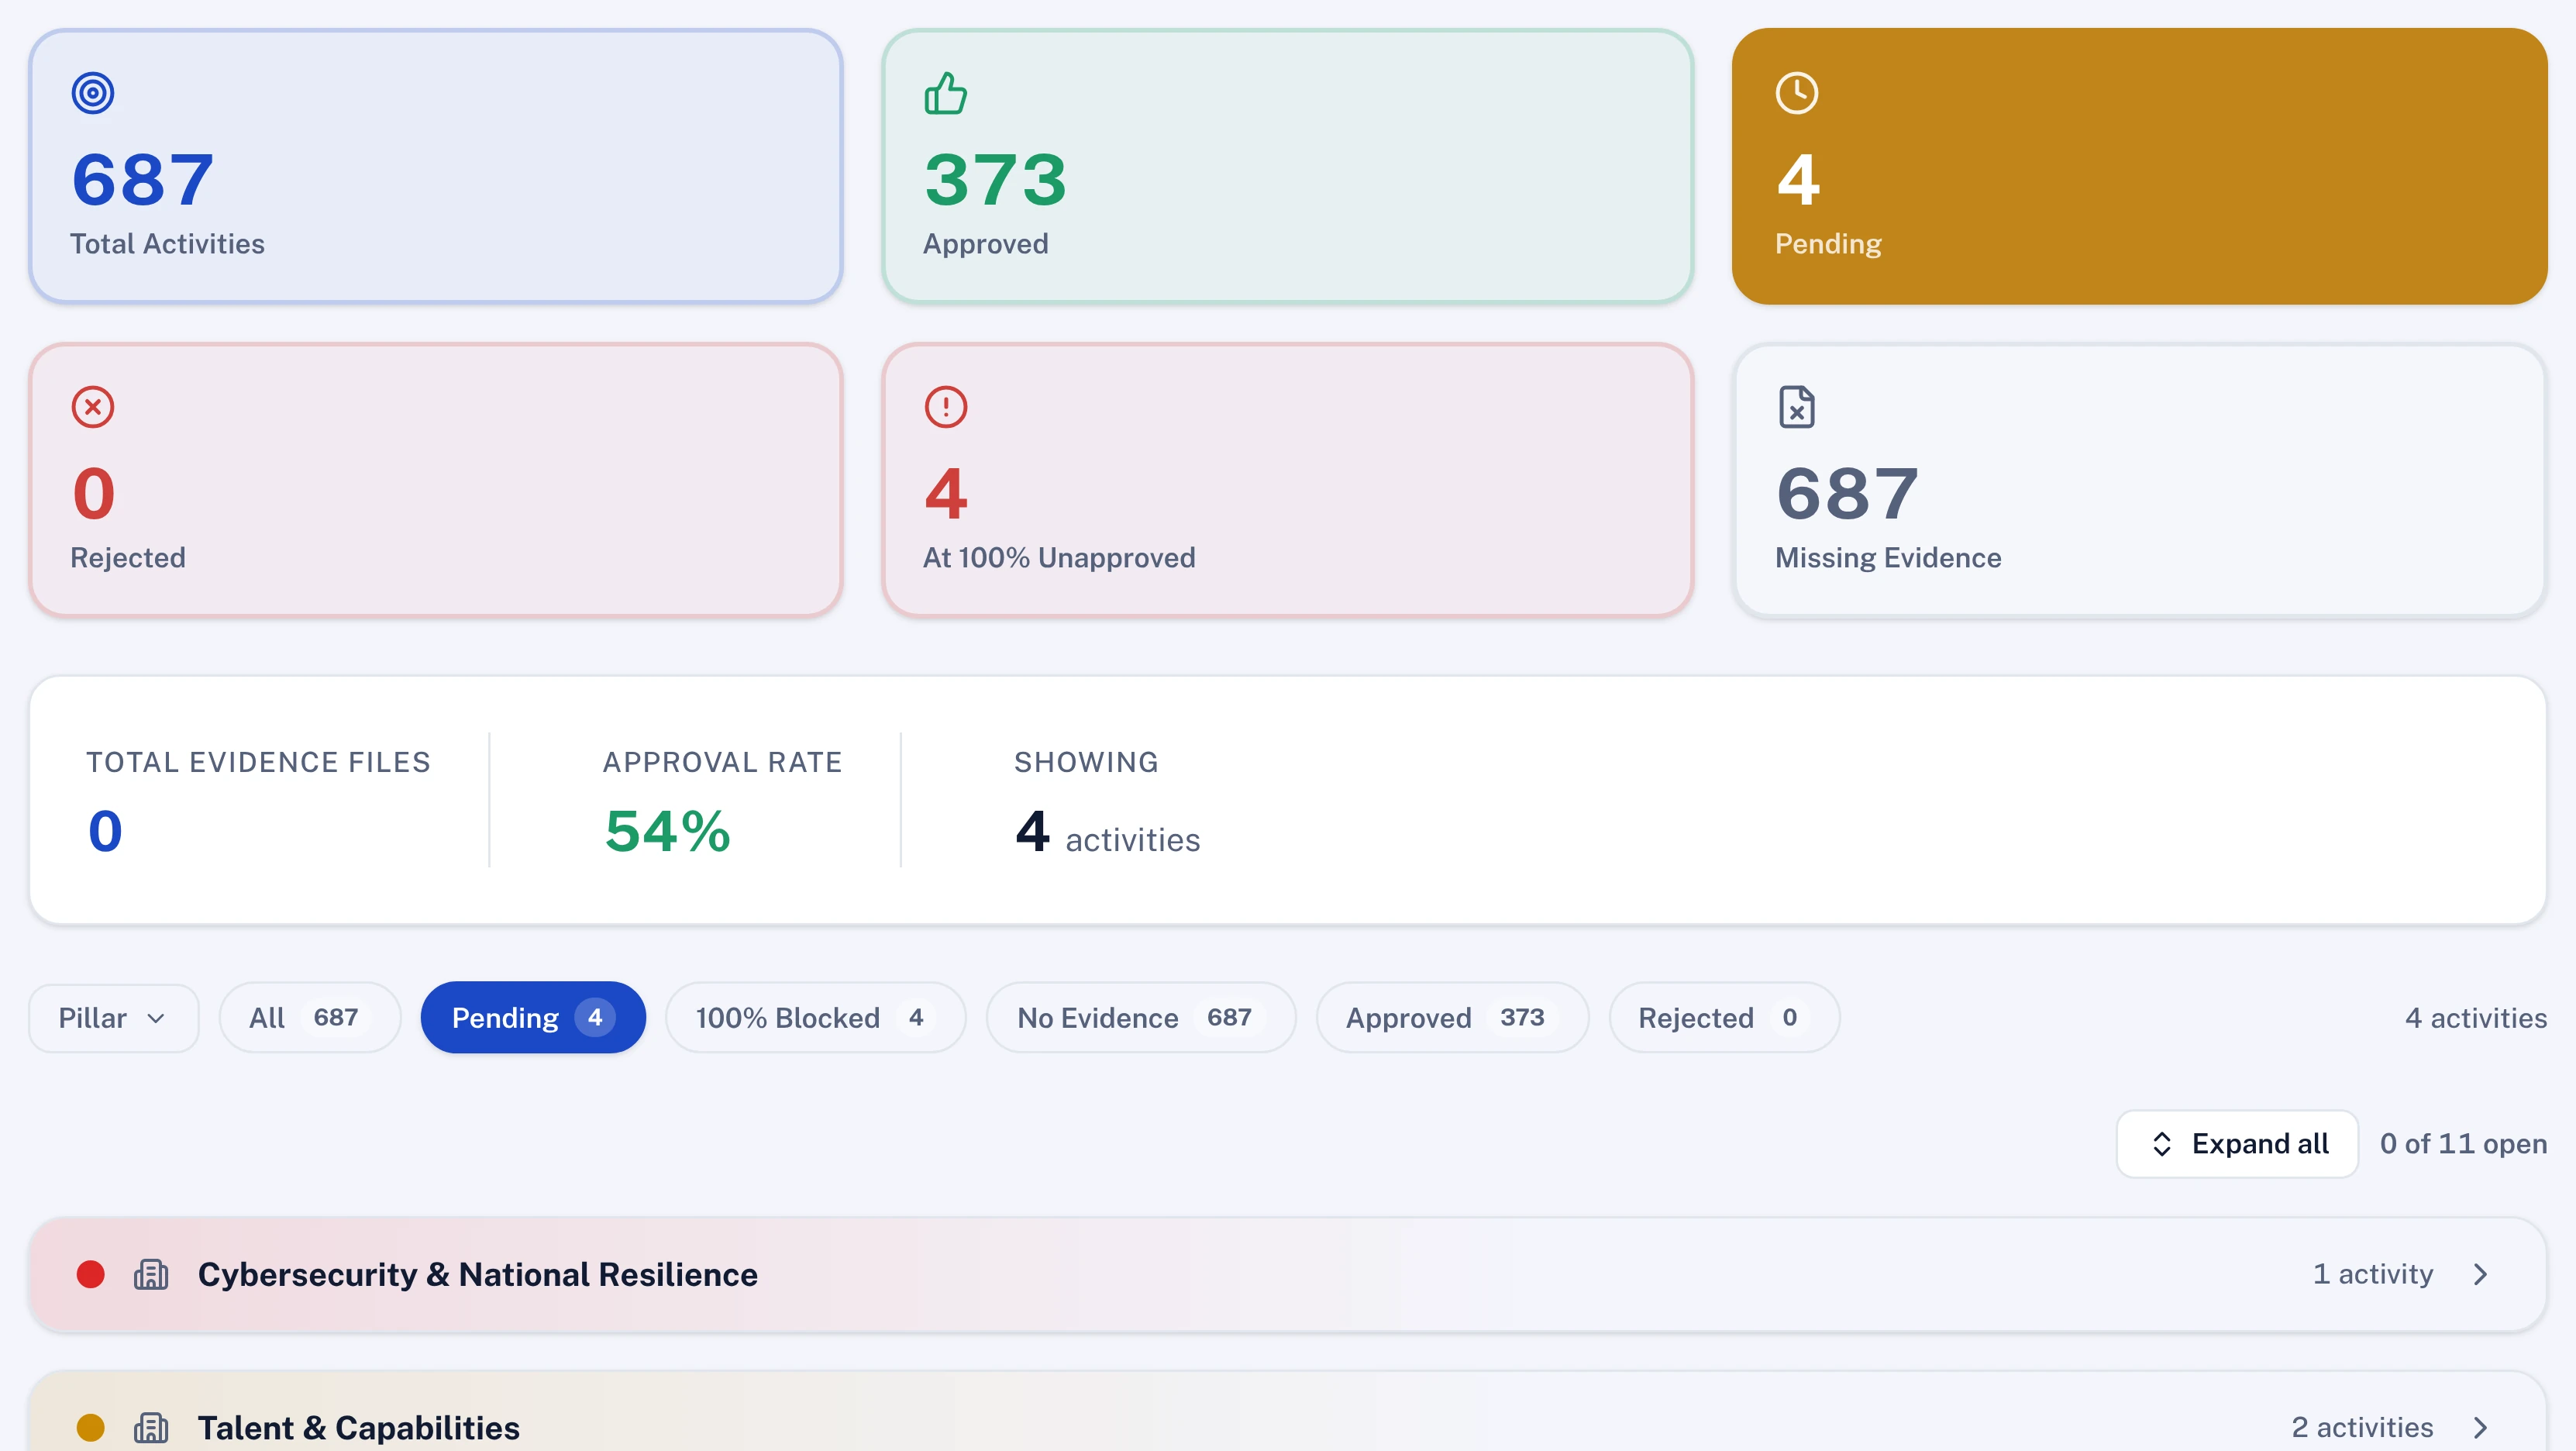
Completion counts in full only once it is approved
Earned value is the project's budget multiplied by its progress, and progress rolls up from the activities on the plan. An activity reported at 100% counts at a capped value, 95% by default, until it is approved.
- Progress rolled up from weighted activities
- The cap is set by an administrator
- Work at 100% but unapproved is listed
Actual cost from paid invoices
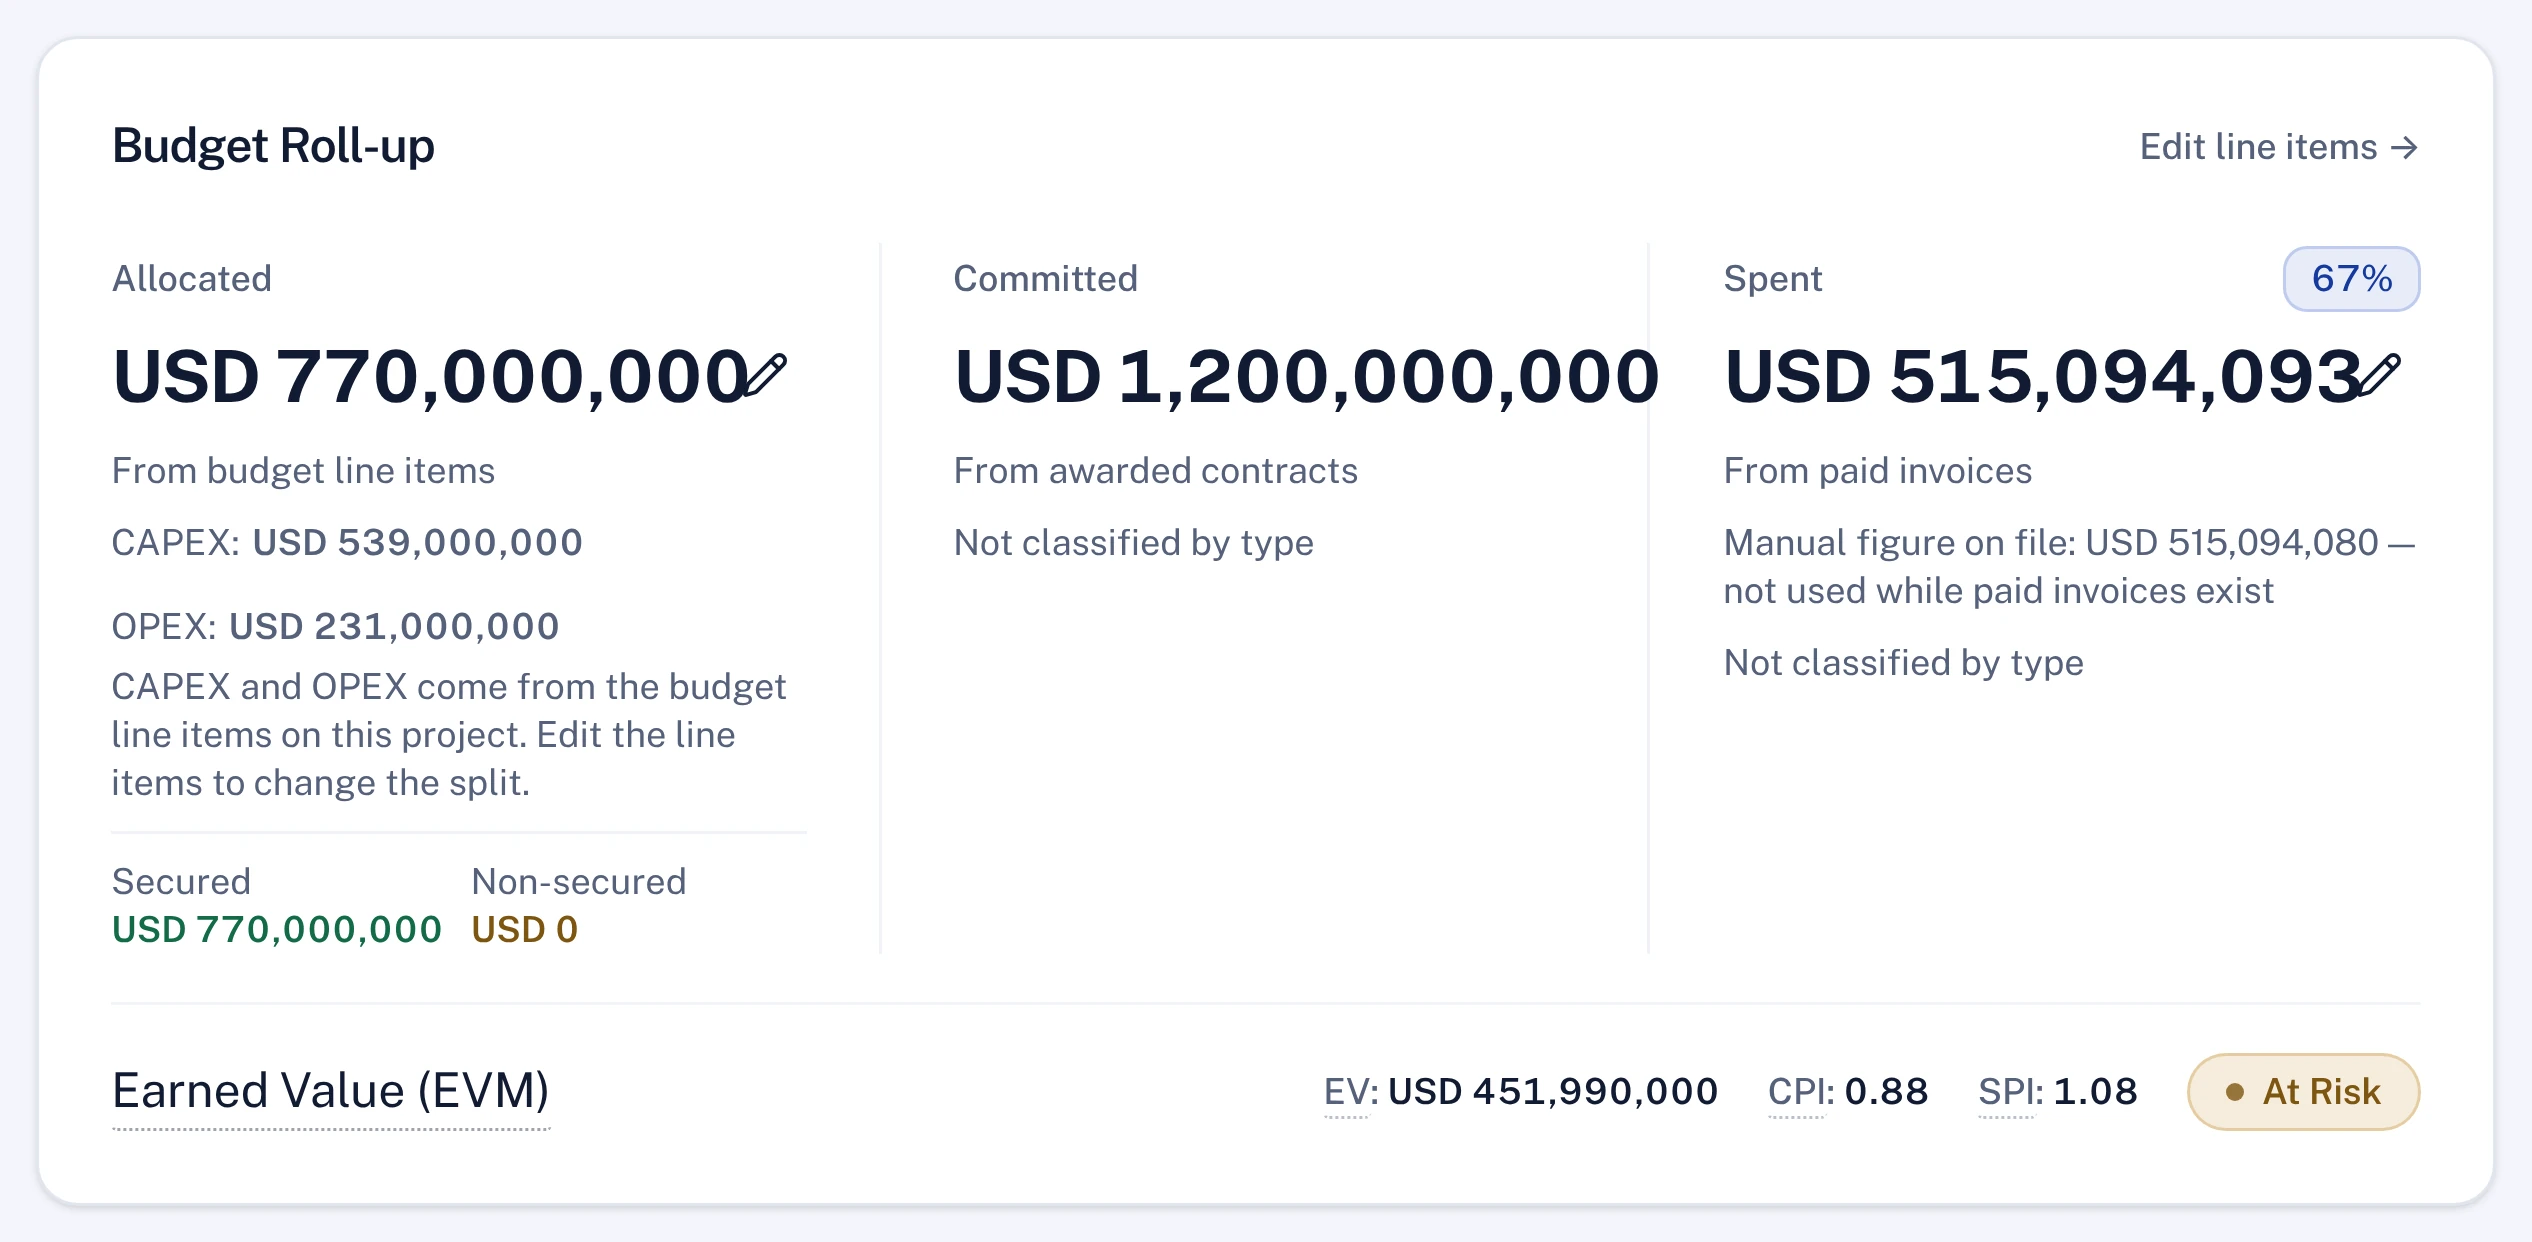
Actual cost is the project's spent figure, which reads paid invoices first, then spend recorded on budget lines, then a figure entered by hand. Invoices in other currencies are converted to the workspace's reporting currency.
- Allocated from budget lines
- Committed from awarded contracts
- EV, CPI and SPI on the project's financials
Spend against progress across the programme
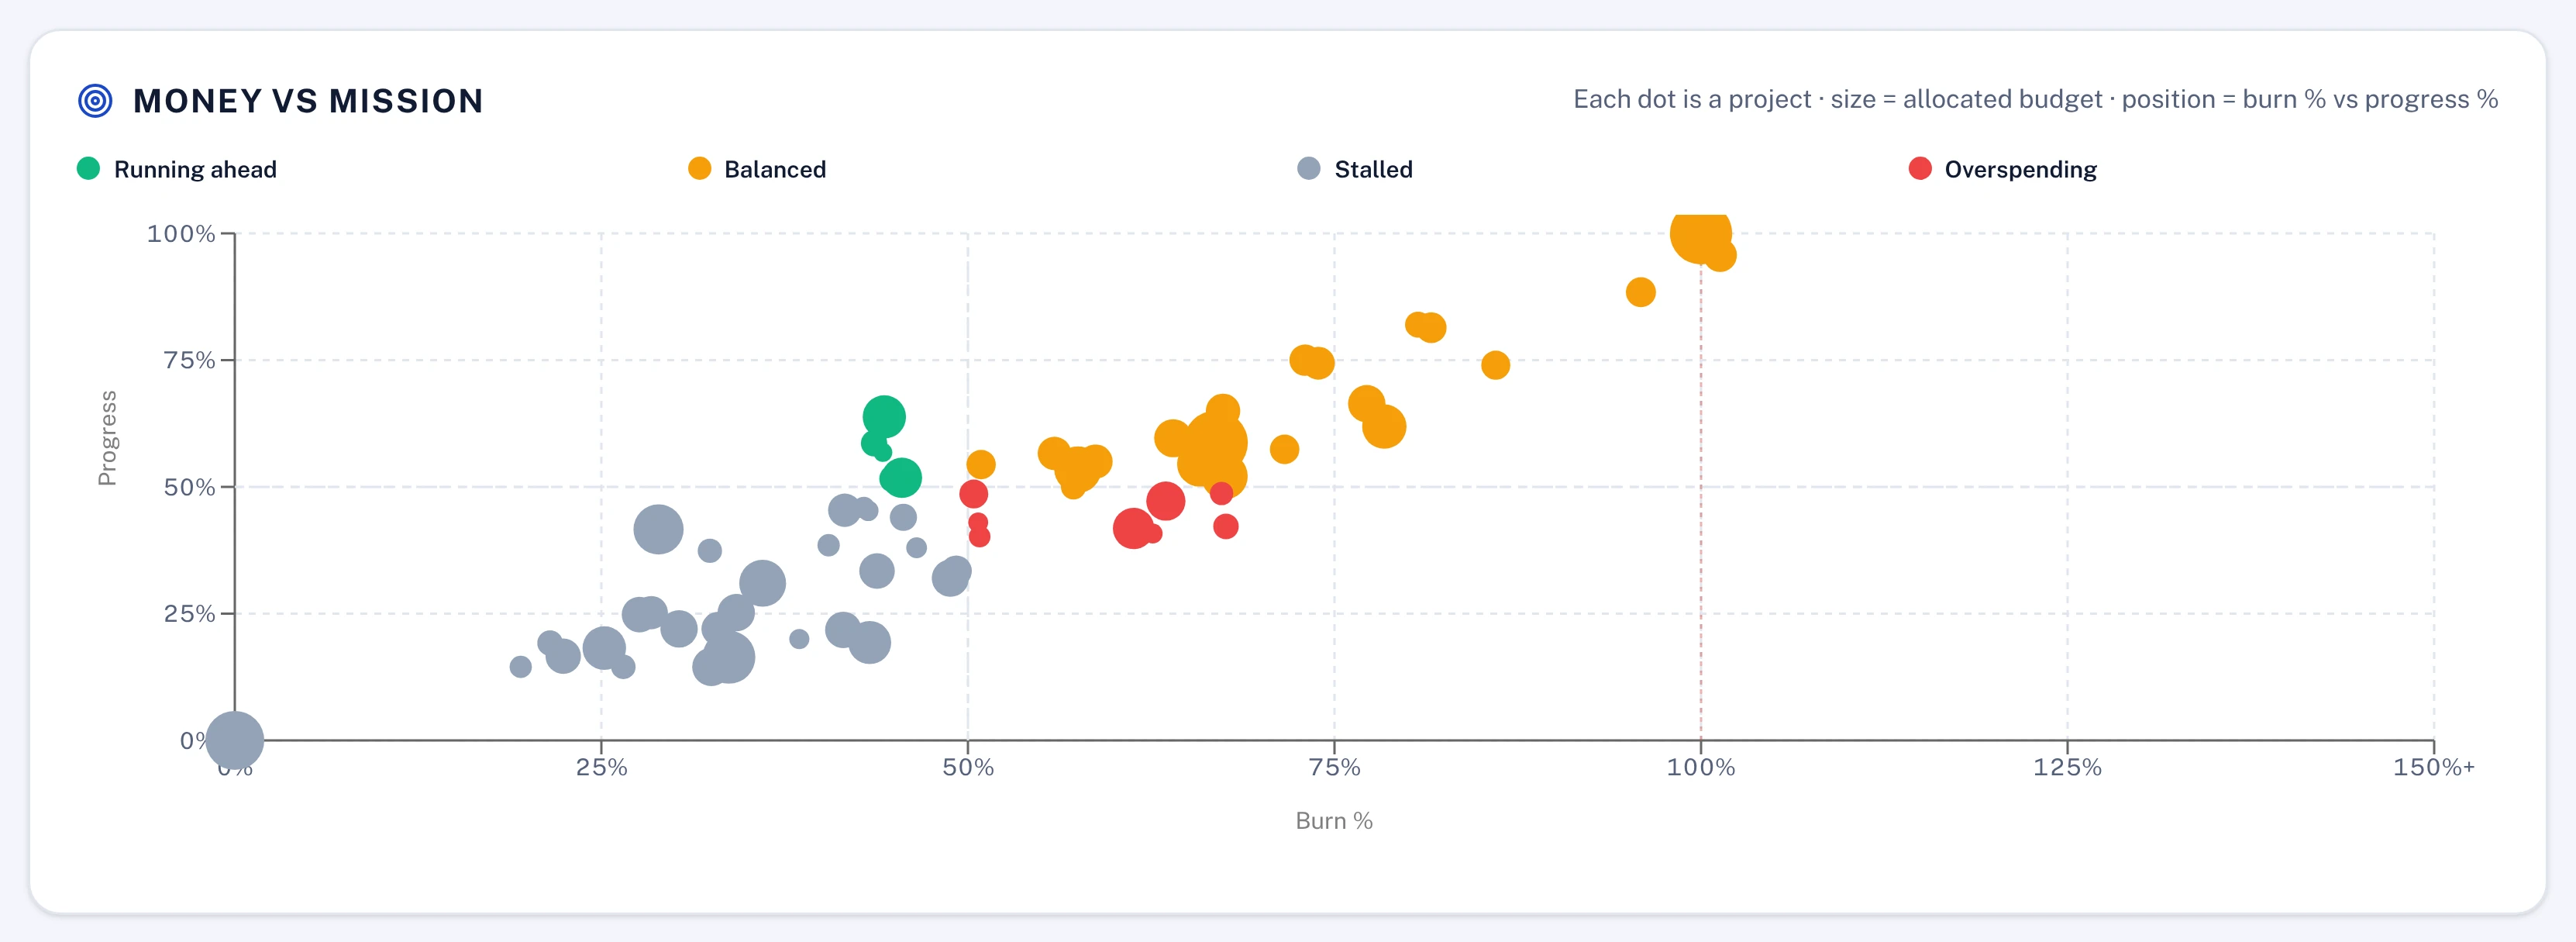
Every project is plotted by the share of its budget it has burned against the progress it has made, sized by its allocated budget. Projects spending ahead of delivery stand apart from the ones that are balanced, stalled or running ahead.
- Running ahead, balanced, stalled, overspending
- Dot size shows the allocated budget
- Capital at risk totalled
A forecast final that is computed
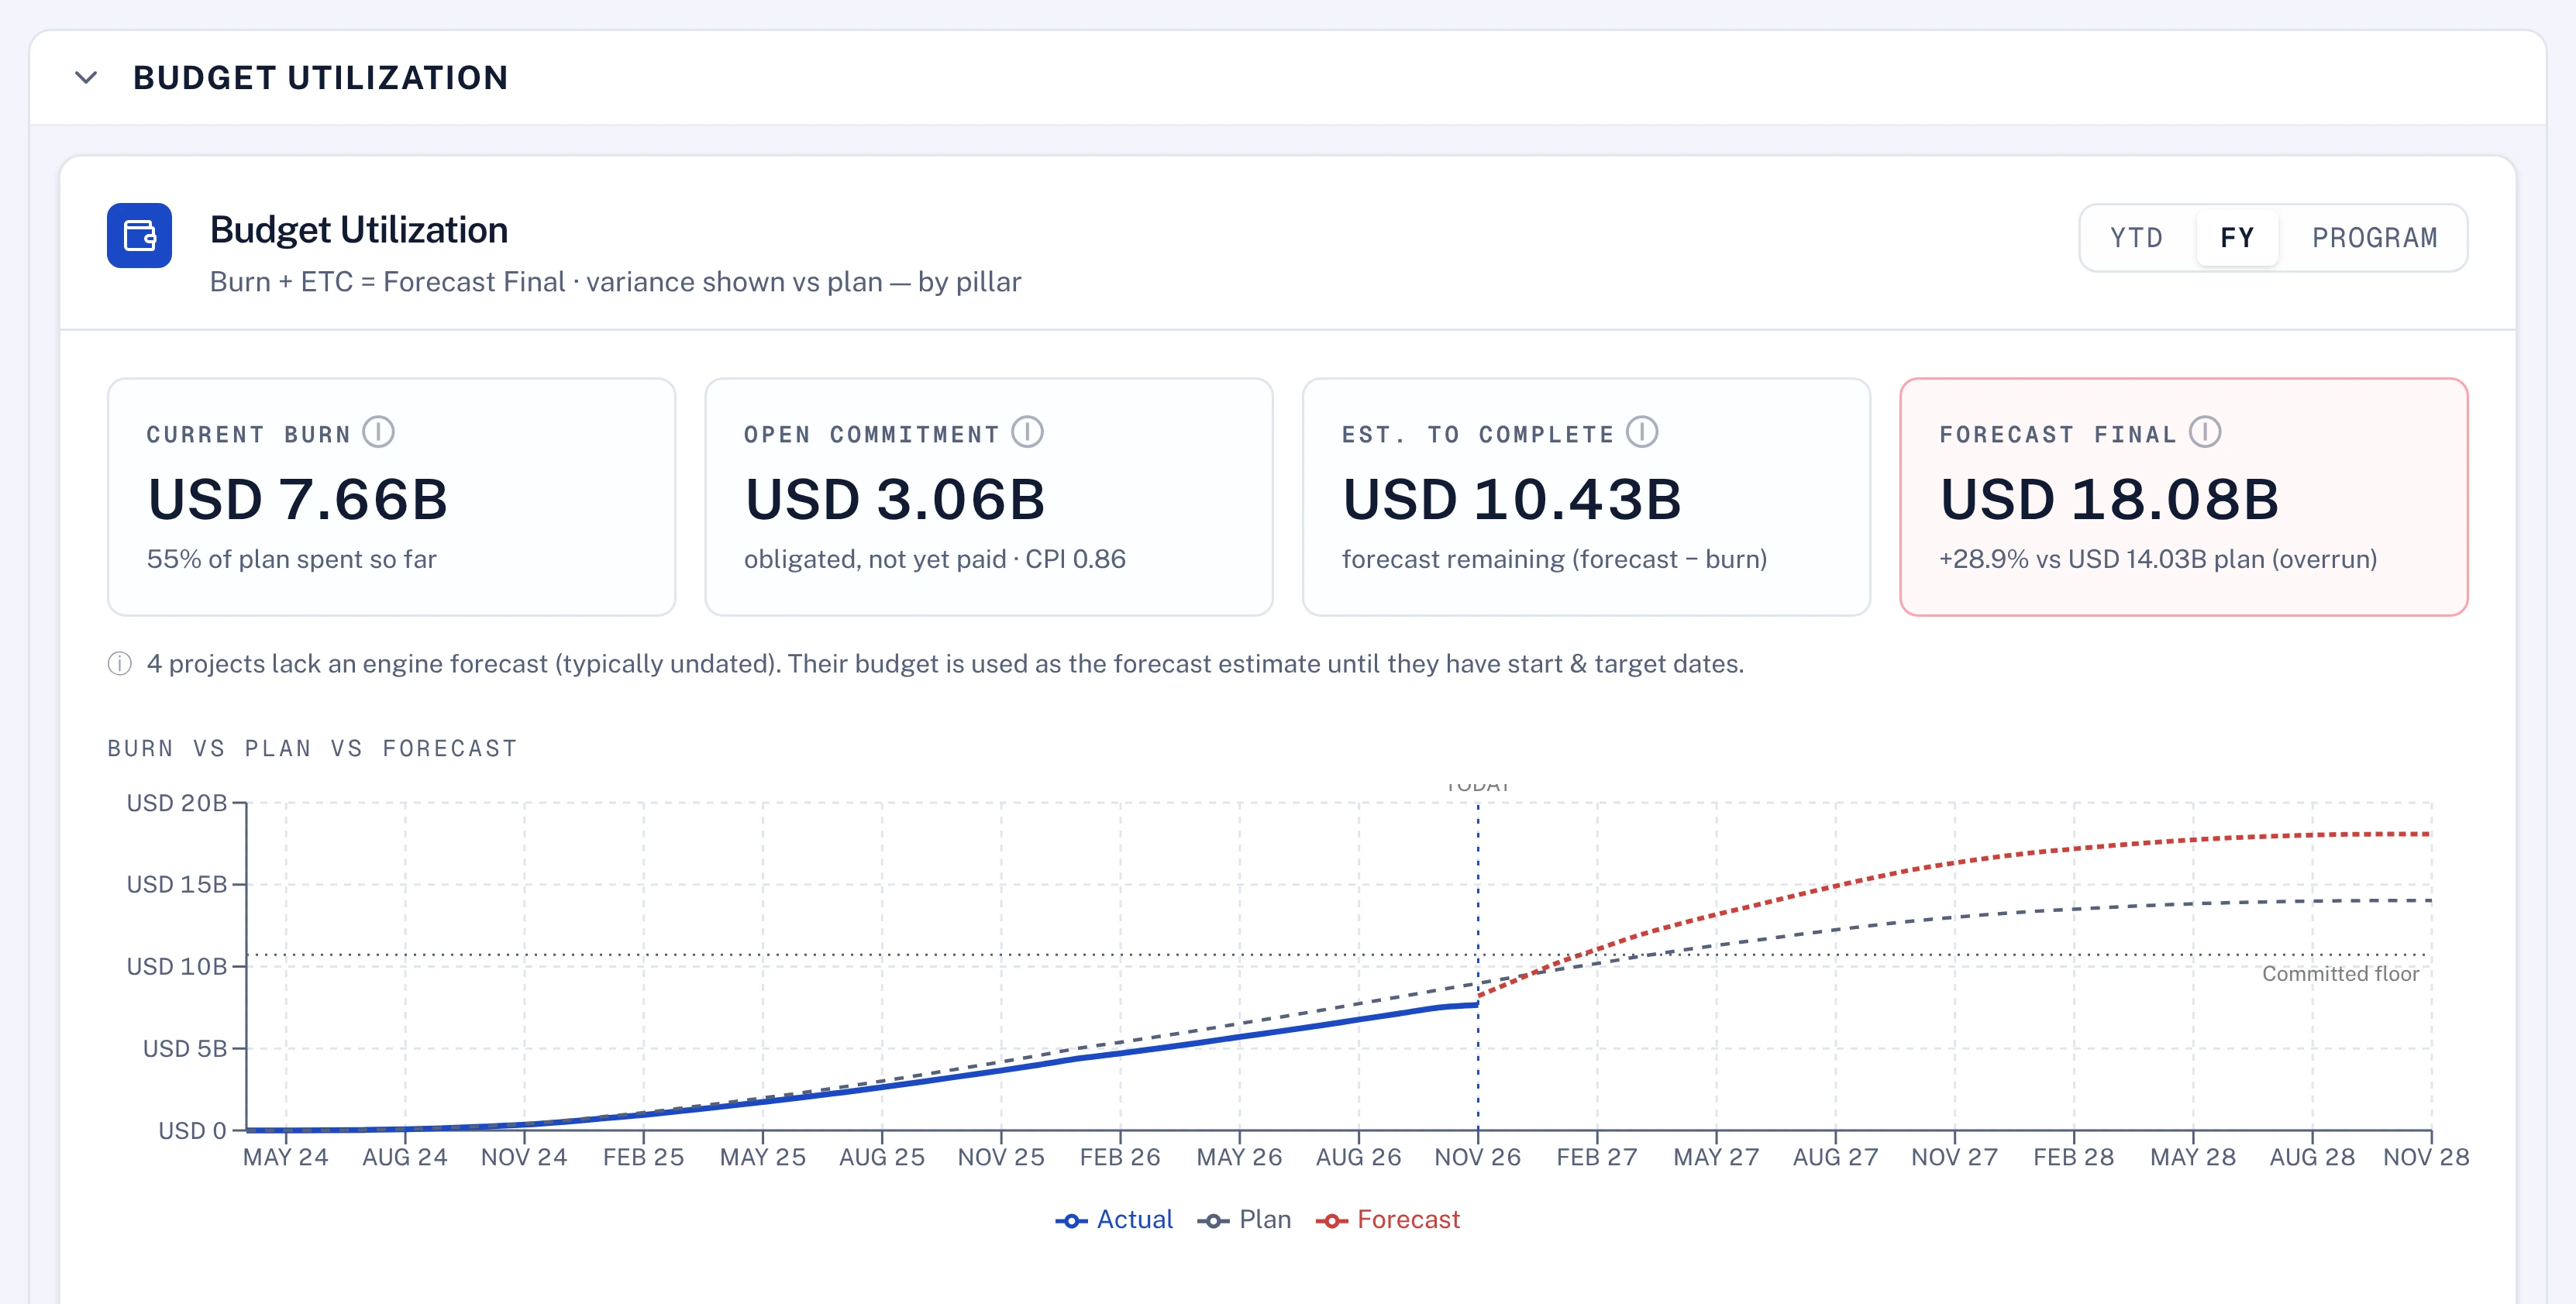
The estimate at completion is the budget divided by the cost performance index, so a falling index moves the forecast straight away. On the executive dashboard, burn plus the estimate to complete gives the forecast final, with variance against plan by pillar.
- Cost and schedule variance per project
- Overrun and underspend flagged in Analytics
- New projects held in a guard period first
What you get
Every item runs on the same engines the screens use.
Planned value, earned value and actual cost for every active project.
Cost and schedule indices, with a status for each and one overall verdict.
Cost variance, schedule variance and the estimate at completion per project.
Planned value follows the dated, weighted activities on the schedule.
Each column header explains its measure and shows its formula.
Money figures are hidden from people without financial access to a project.
Questions
Which earned value figures does Lodestar show?
Planned value, earned value, actual cost, CPI, SPI, cost variance, schedule variance and the estimate at completion, per project. Each project also gets a cost status, a schedule status and one overall verdict: healthy, at risk or critical.
Do we need timesheets?
No. Earned value comes from progress on the plan, and actual cost from paid invoices, budget lines or an entered figure. Nothing depends on hours being booked.
Does it replace our finance system?
No. The finance system stays the system of record. Its actuals can arrive through the ERP integration and are placed against the budget and the plan.
Which currency are the figures in?
The workspace's reporting currency. Invoices in another currency are converted with the exchange rates you configure, so every earned value figure is shown in one currency.
From the blog
Our founders on earned value. More on this topic
Approved against people who are already booked
Much of what is called change fatigue is a capacity problem: portfolios are approved against money while the same teams and experts are booked past what they can carry. Approve against capacity by team and month, sequence instead of stacking, and treat each start as a decision.
The project nobody will stop: write the exit at the entry
A portfolio that only ever adds work starves its best projects. Write the conditions for stopping on the day a project is approved, judge each review by how much money and how many people move, and make a stop a decision with a route, an approver and a record.
Portfolio reviews that decide something
A portfolio review that gives every project equal time informs the room and decides nothing. Put every project on one scale, take the exceptions first, state the decision wanted before the meeting, and record each decision with an owner and a date.