↑↓ to moveEnter to openAll results →

    Turn the strategy into targets every team can see and move

    Pillars, initiatives and KPIs in one connected model. A board target cascades level by level to the teams that deliver it, and every KPI carries its plan, its actual readings and where it is forecast to land.

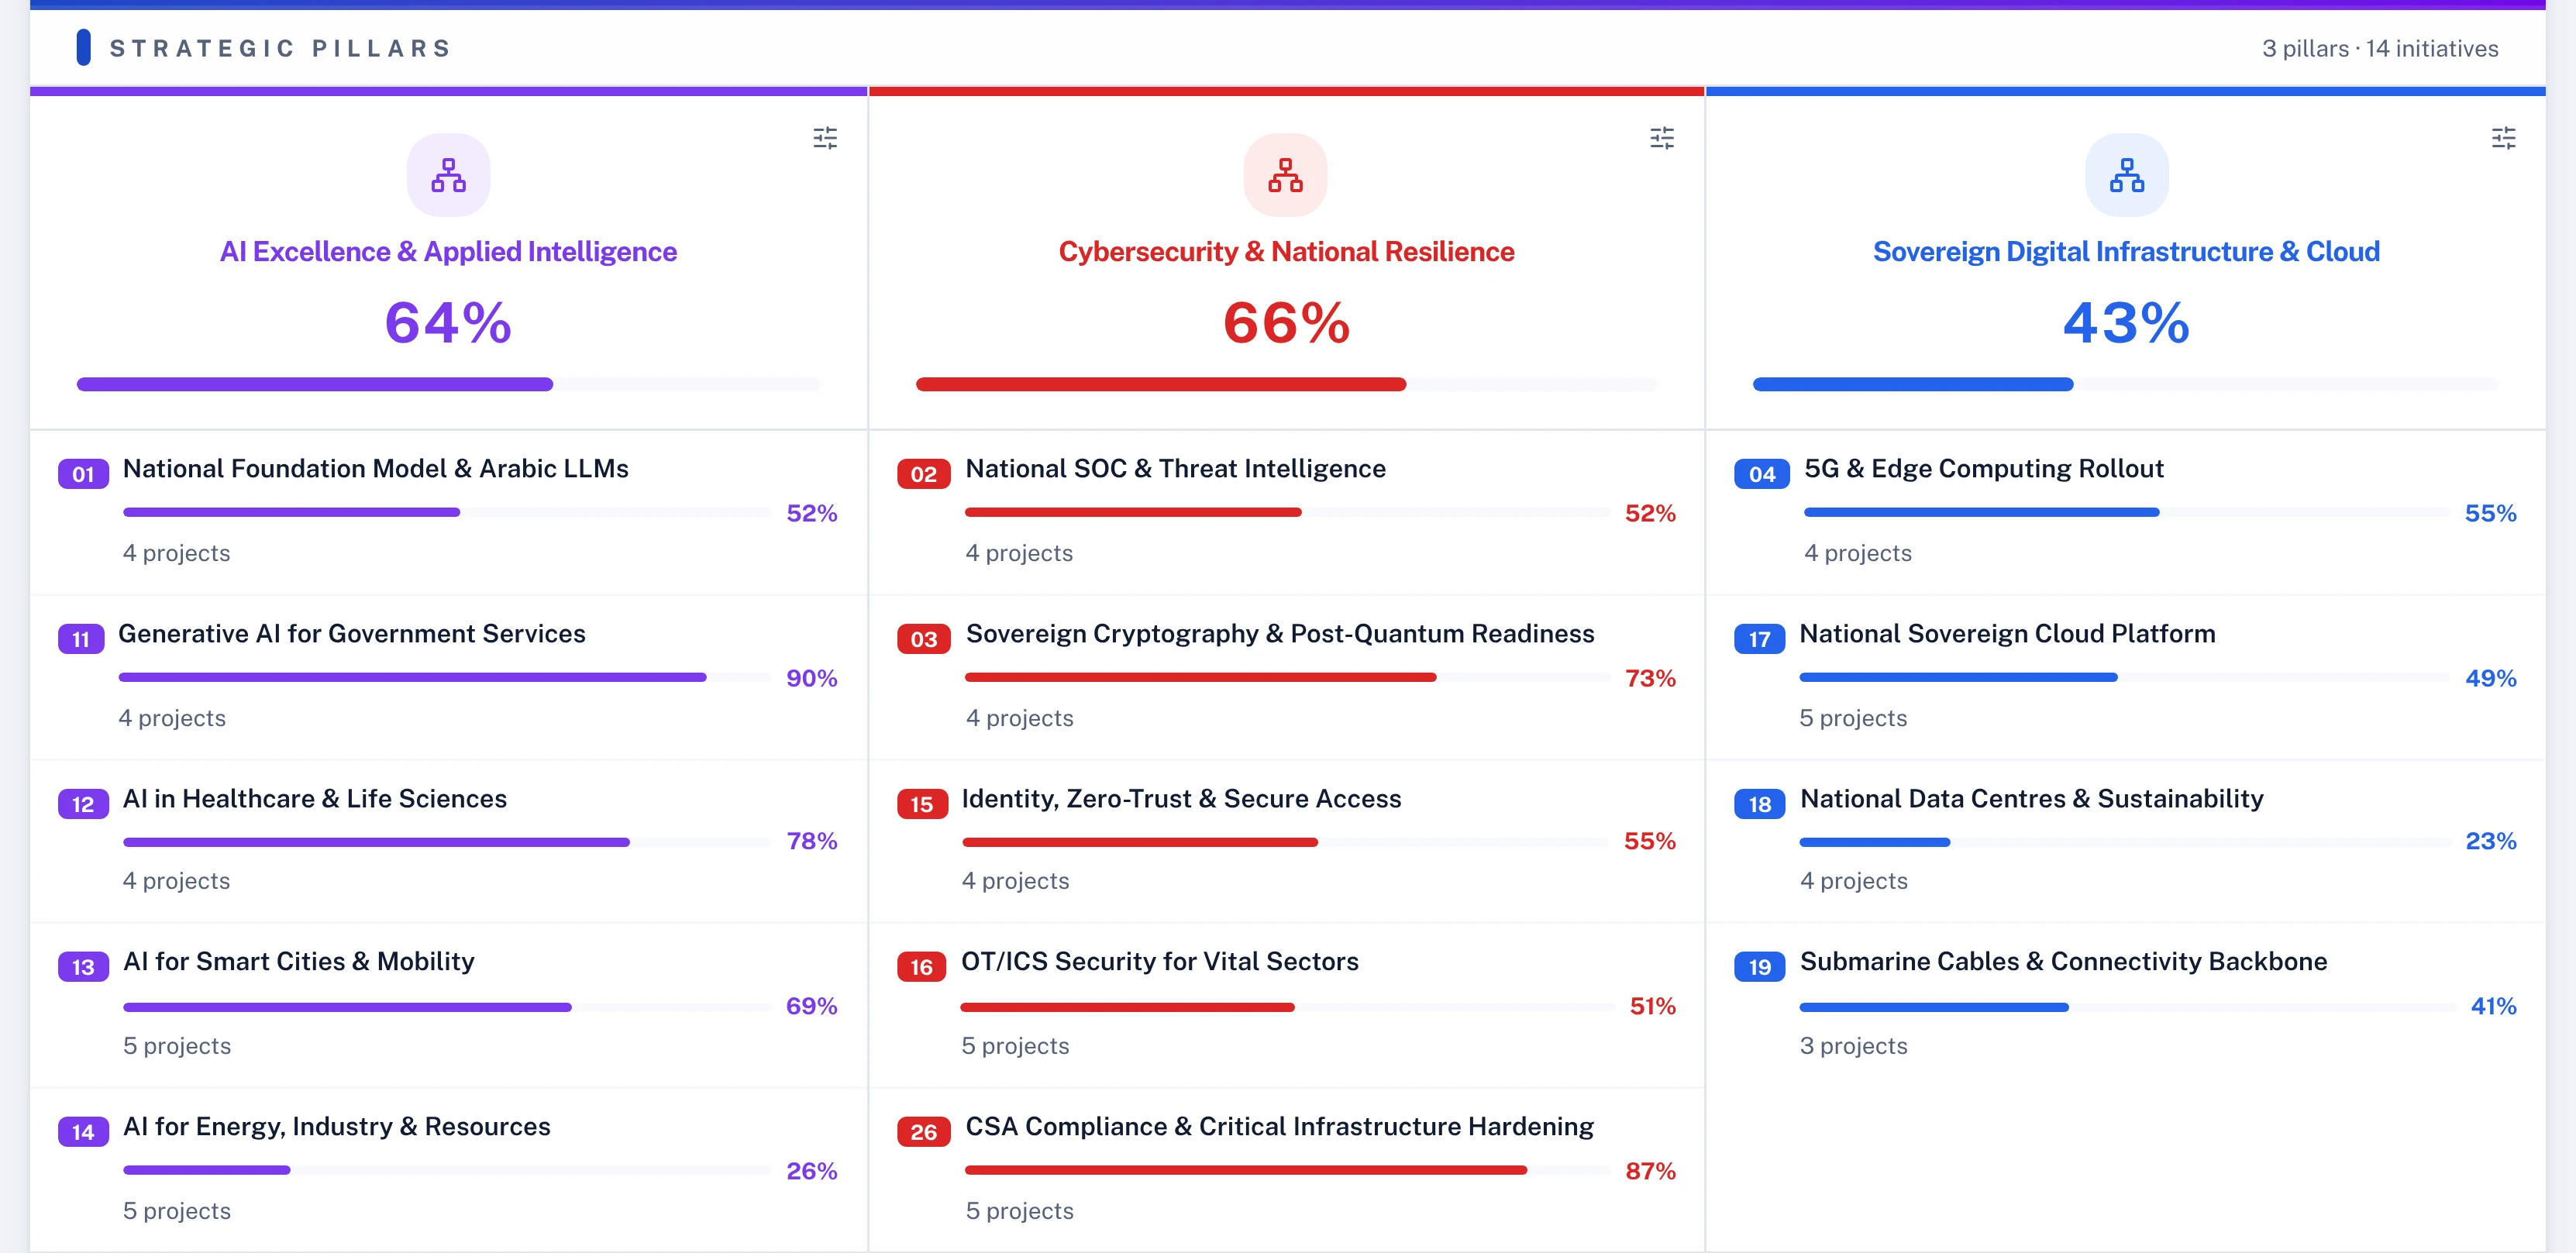
    Strategic pillars with their progress and the initiatives under each
    Strategic pillars. Each pillar's progress and every initiative that rolls up into it.

    What usually goes wrong

    And what changes when it runs on one model.

    01

    Targets live in a slide deck

    The strategy is presented once a year and then nobody can see it move.

    02

    KPIs have no owner

    A number with no named owner and no evidence is reported, not managed.

    03

    Plans and targets never meet

    The initiatives that should move a KPI are tracked somewhere else.

    04

    The gap shows at year end

    By the time the annual figure is in, it is too late to recover.

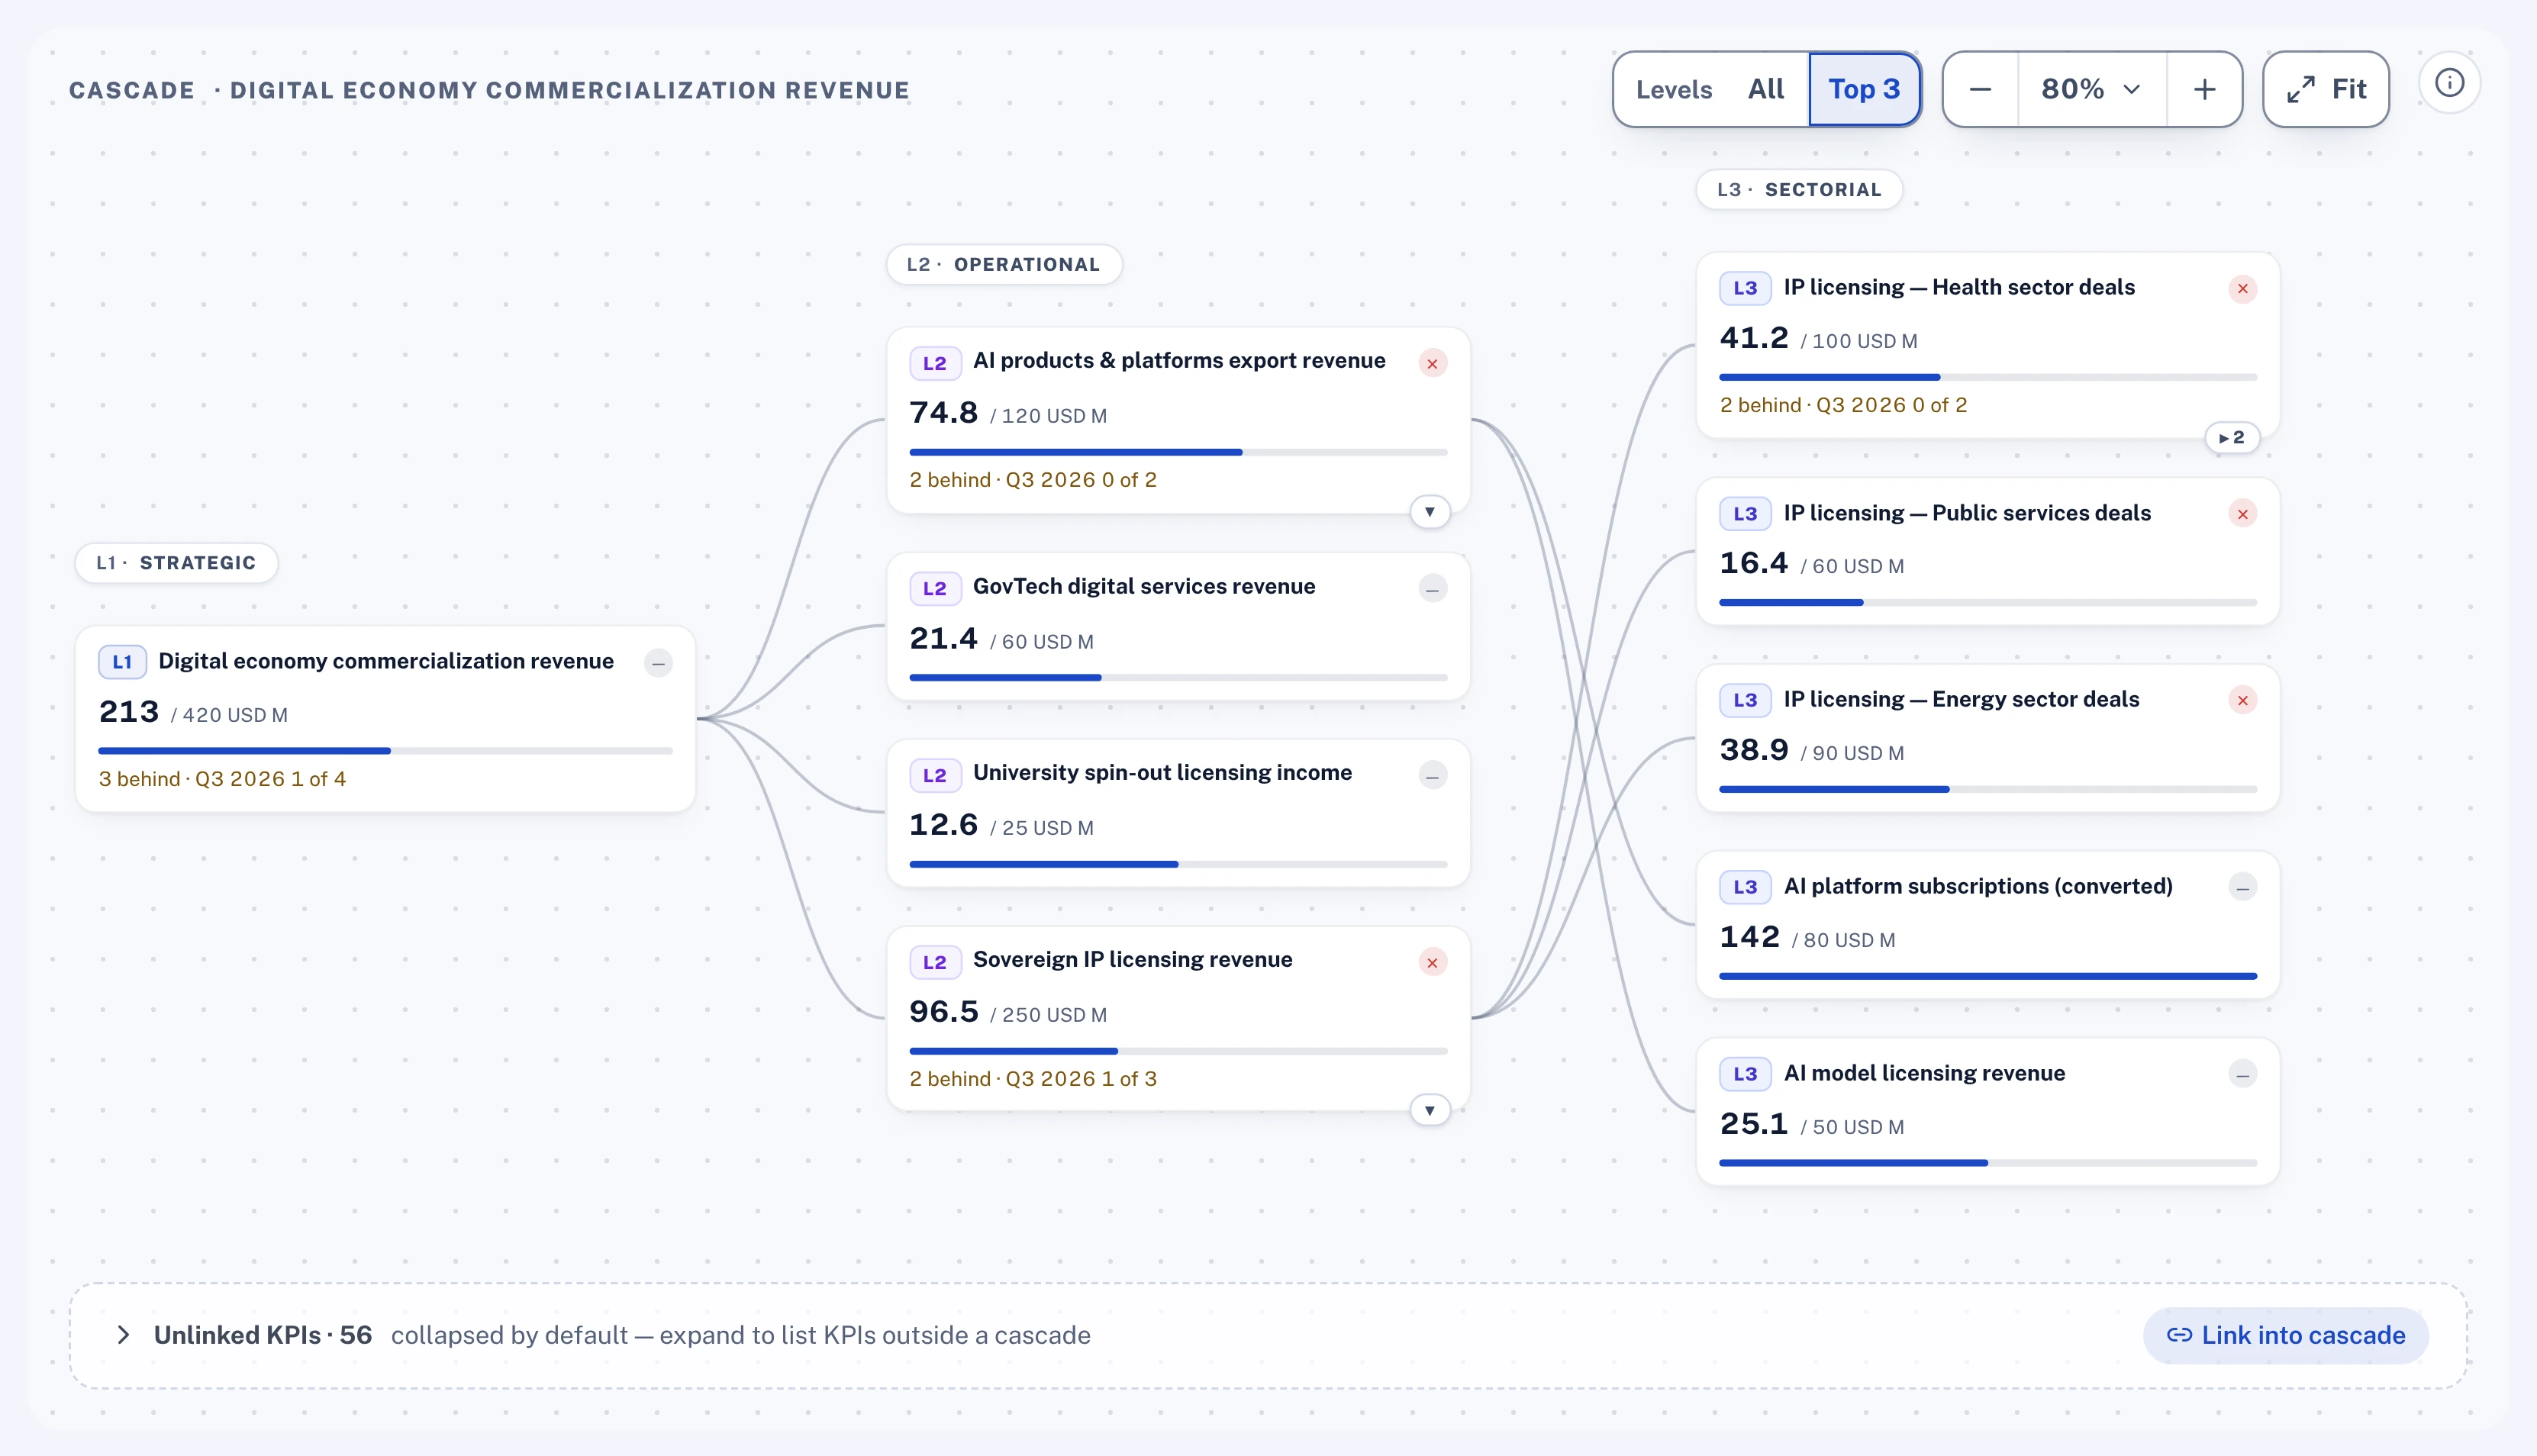
    A cascade from the board's target to the team

    Each strategic KPI breaks down into operational, sectoral, departmental and team KPIs. Progress rolls back up, so a team's miss shows on the board's target the day it is recorded.

    • Up to five levels, from strategic to team
    • Each level shows its value against target
    • Unlinked KPIs listed, so nothing sits outside the cascade by accident
    KPI cascade from a strategic KPI to operational and sectoral KPIs
    KPI cascade. One target, broken down level by level.

    Plan, actual and forecast on every KPI

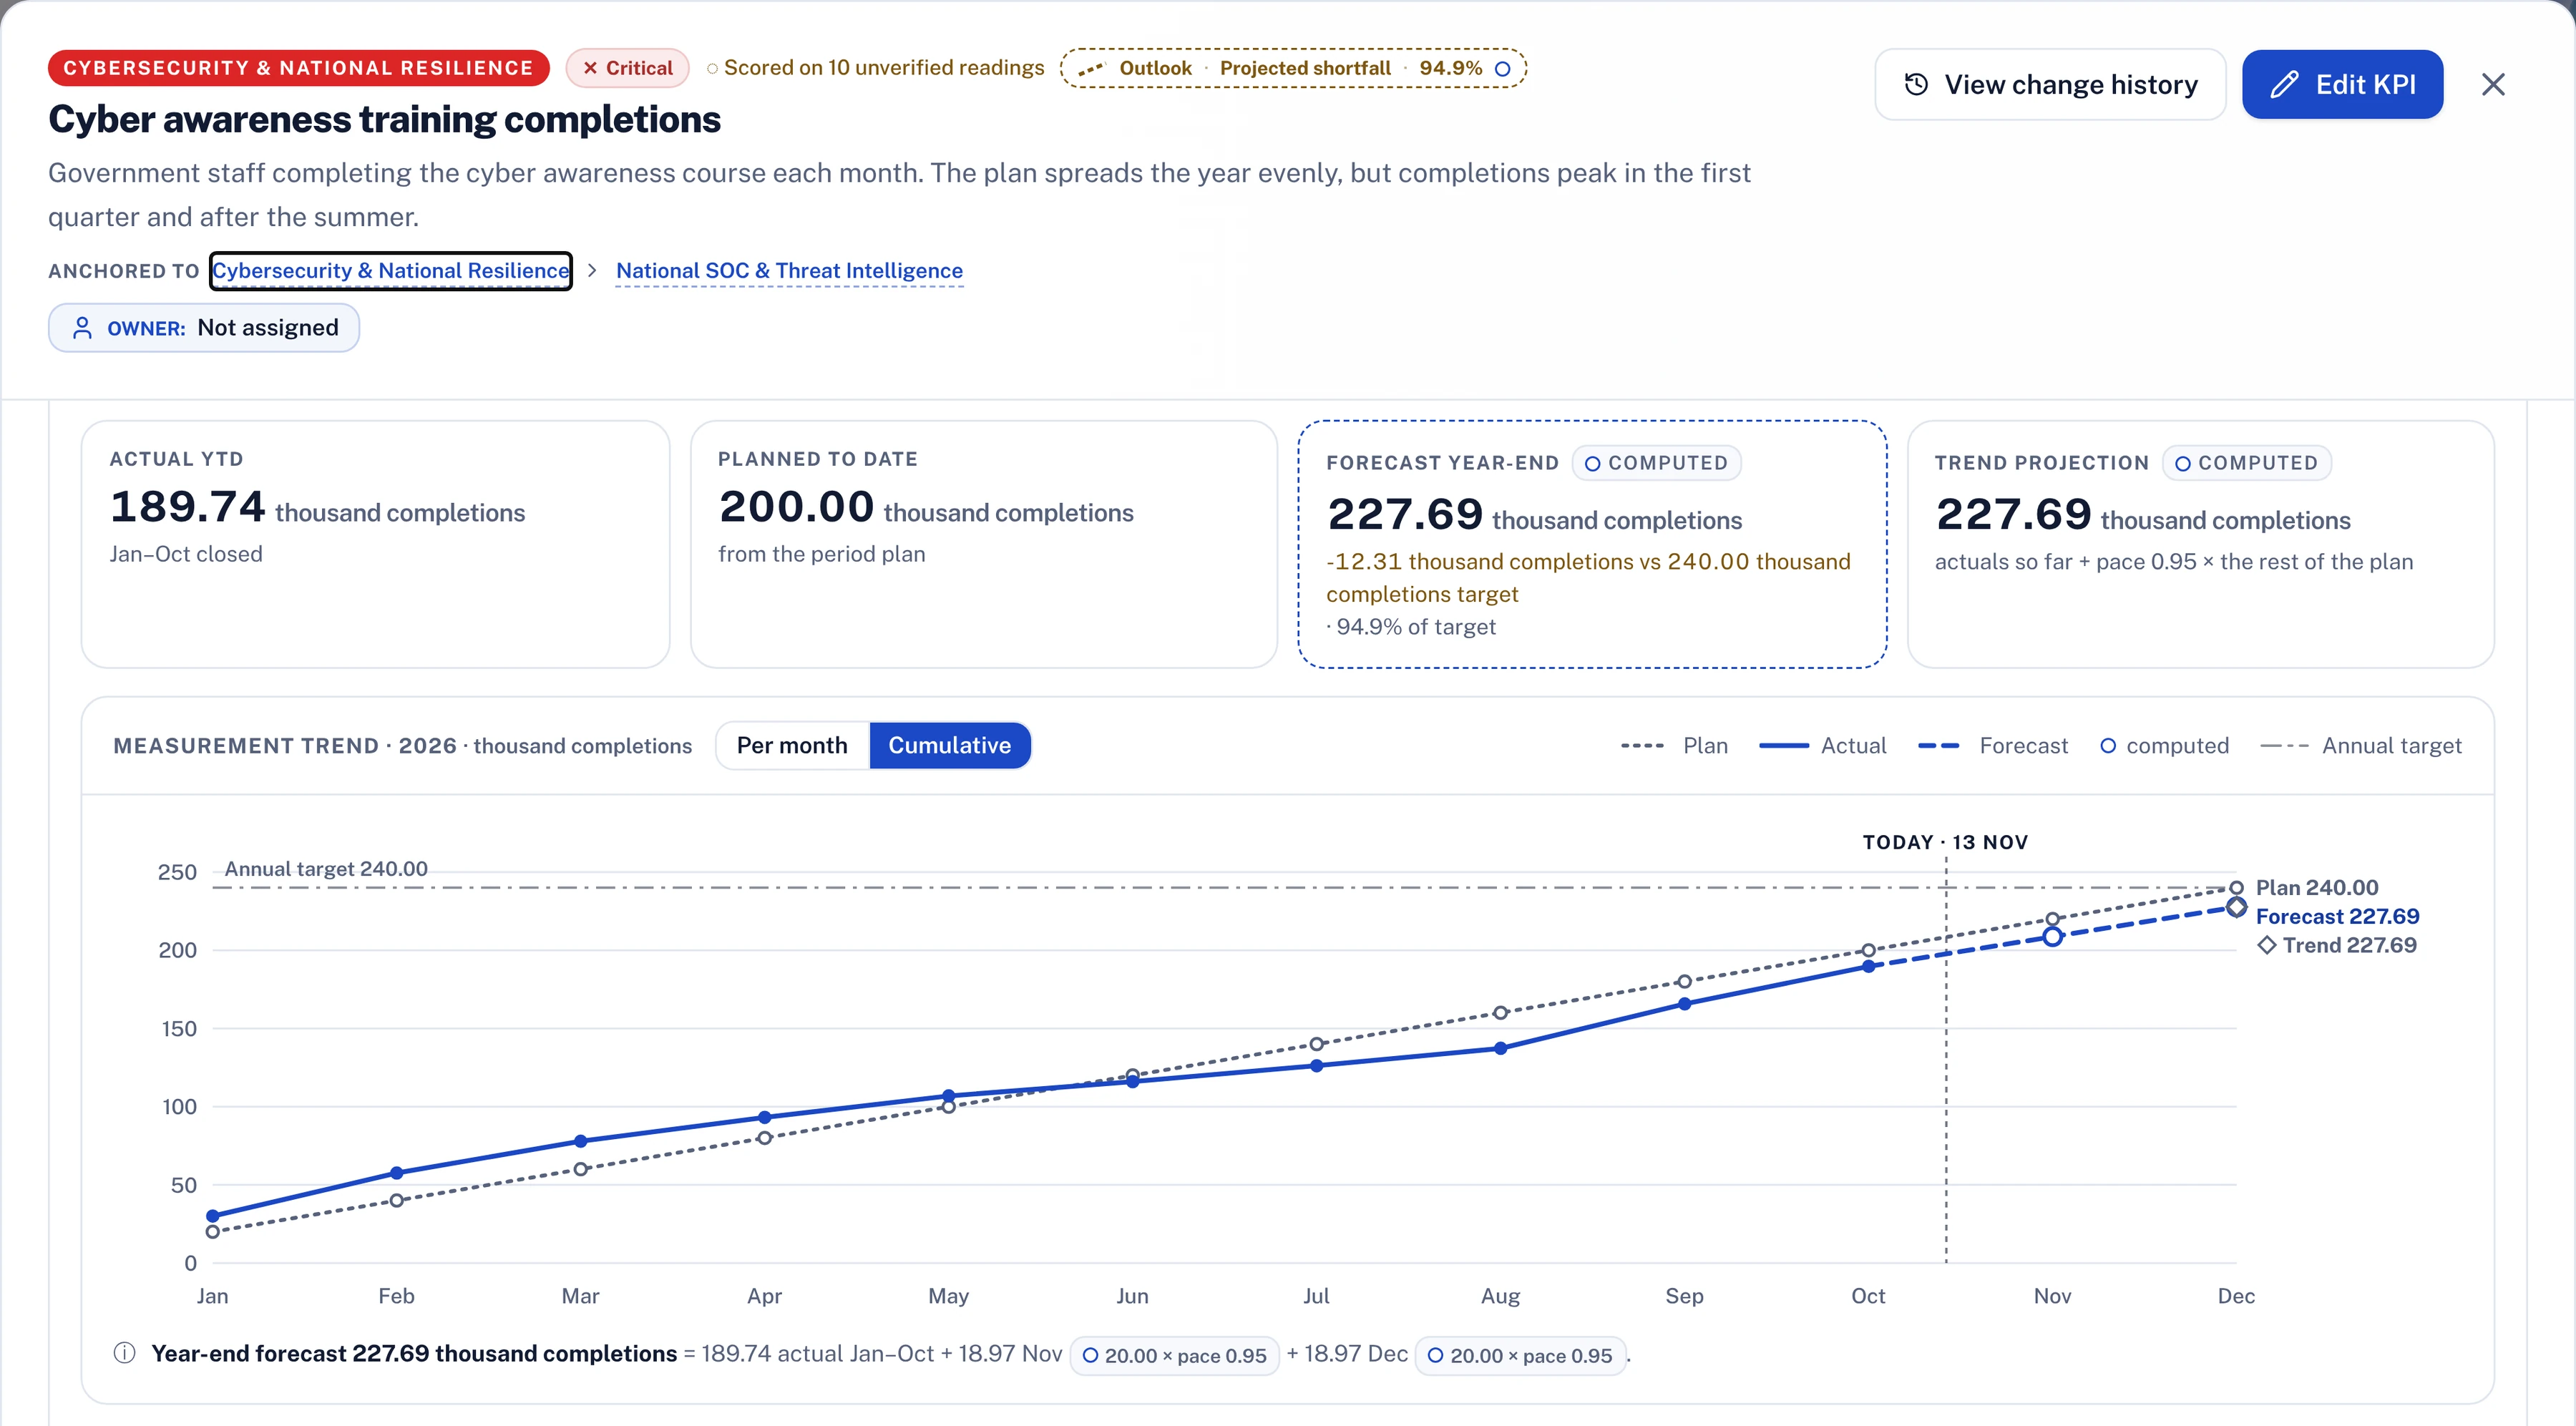
    Readings arrive on the KPI's own cadence. The engine compares the actual with the plan to date and projects the year-end result from the trend.

    • Actual to date against planned to date
    • A computed year-end forecast and trend projection
    • Status scored against the plan to date, never typed
    KPI detail with actual, planned, forecast and trend, and a chart of plan, actual and forecast
    KPI detail. Plan, actual and forecast, month by month.

    Actuals and forecasts entered where the targets are

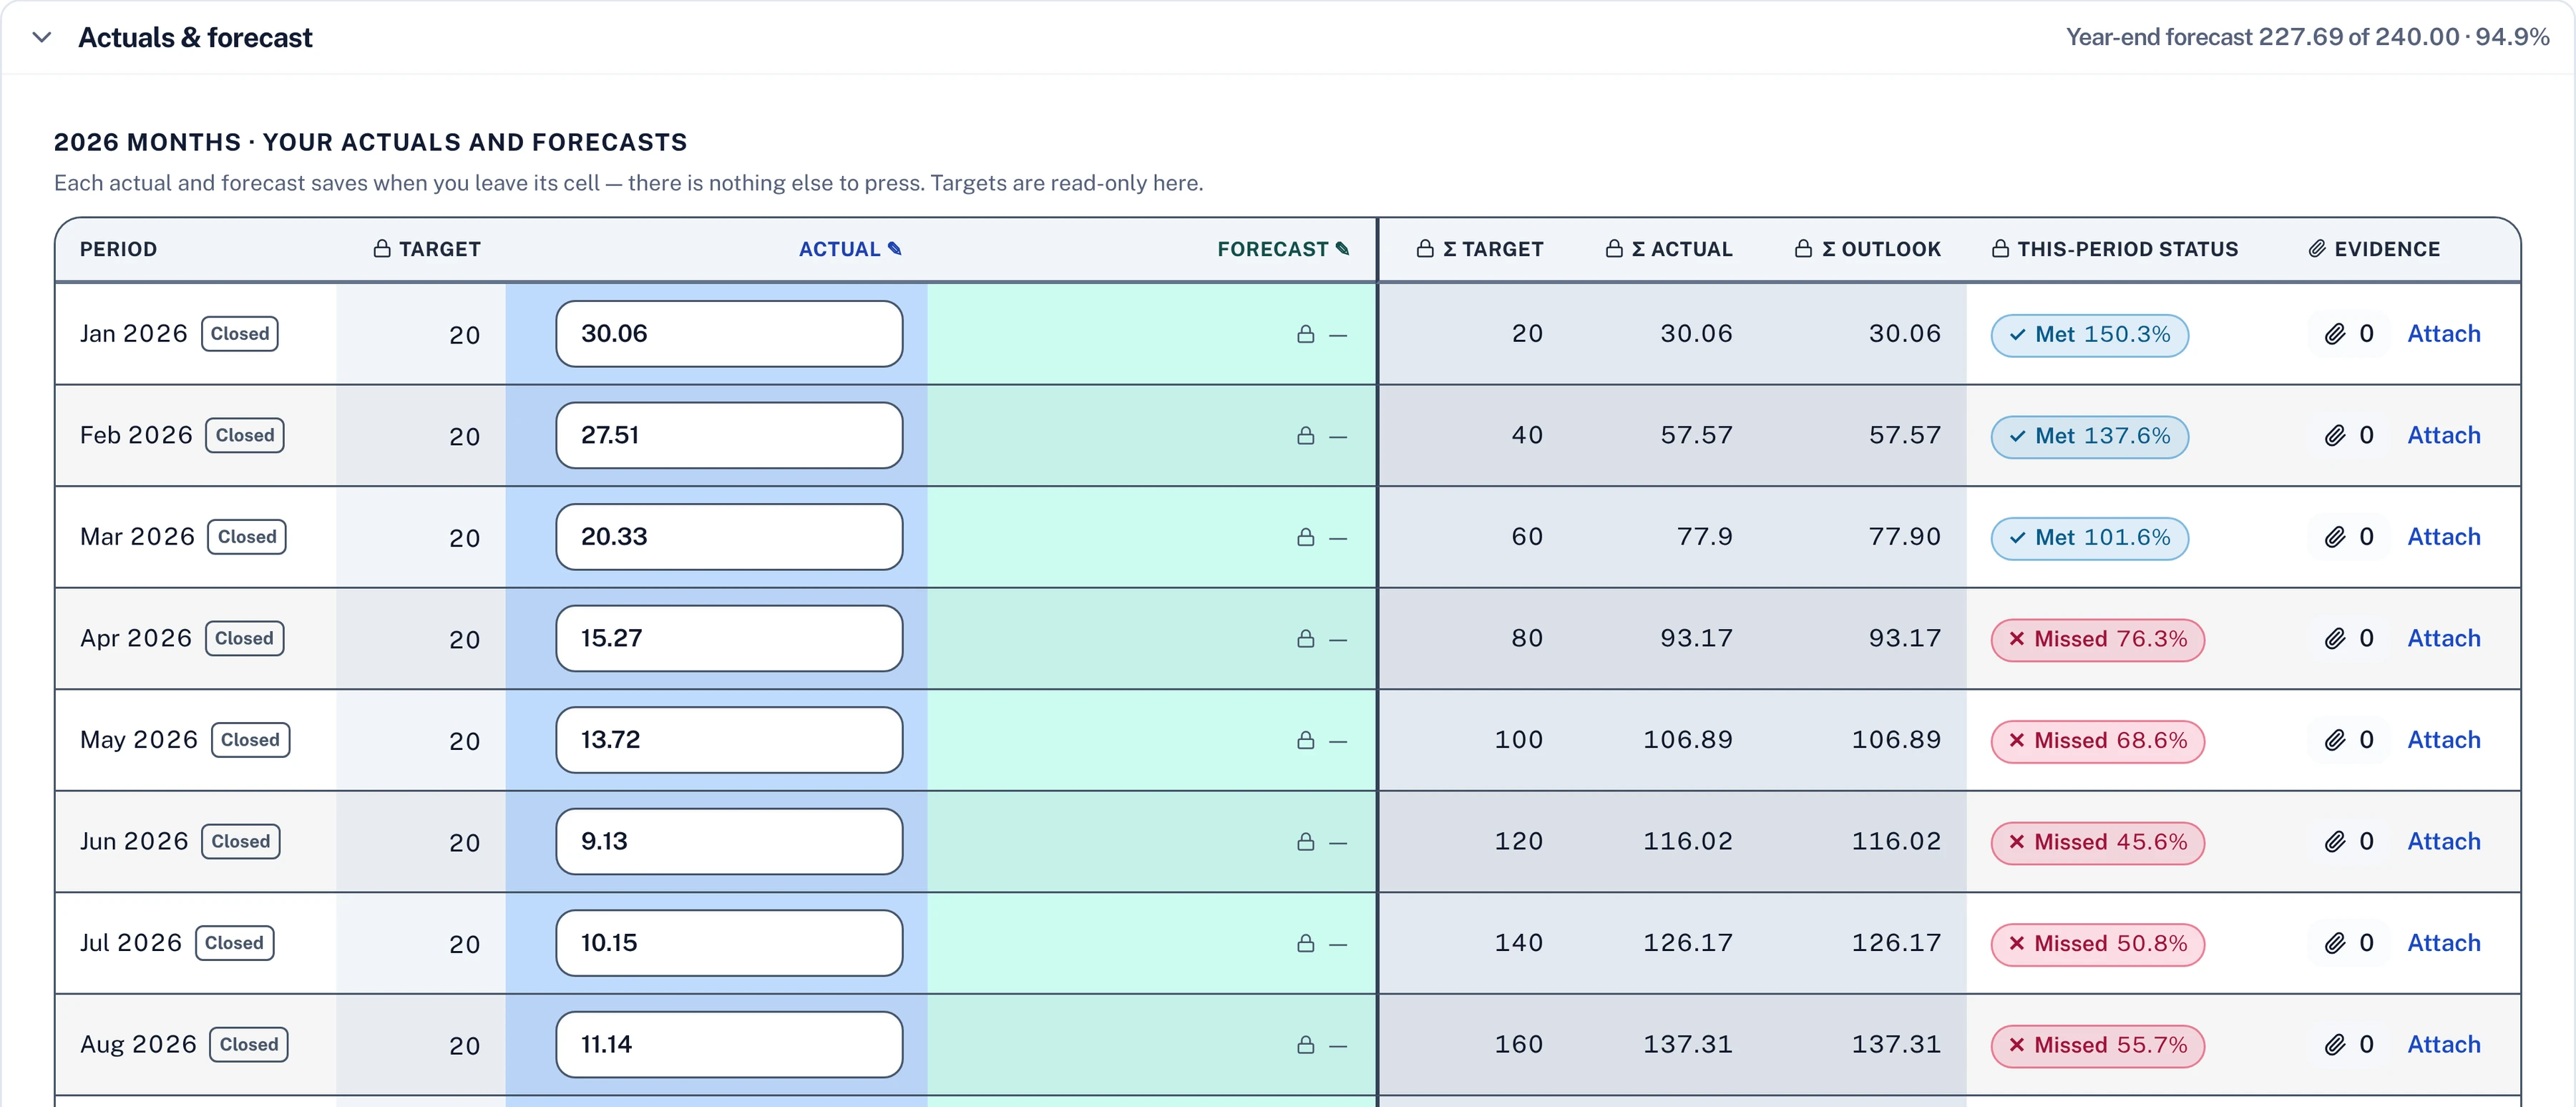
    Owners enter each period's actual and their own forecast beside the target. Each period is scored as met or missed, and the evidence is attached to the reading it supports.

    • Target, actual and forecast per period
    • Running totals against the cumulative target
    • Evidence attached to each reading
    Actuals and forecast table by month with status per period
    Actuals and forecast. Each period's reading against its own target.

    Know which KPIs will miss before they do

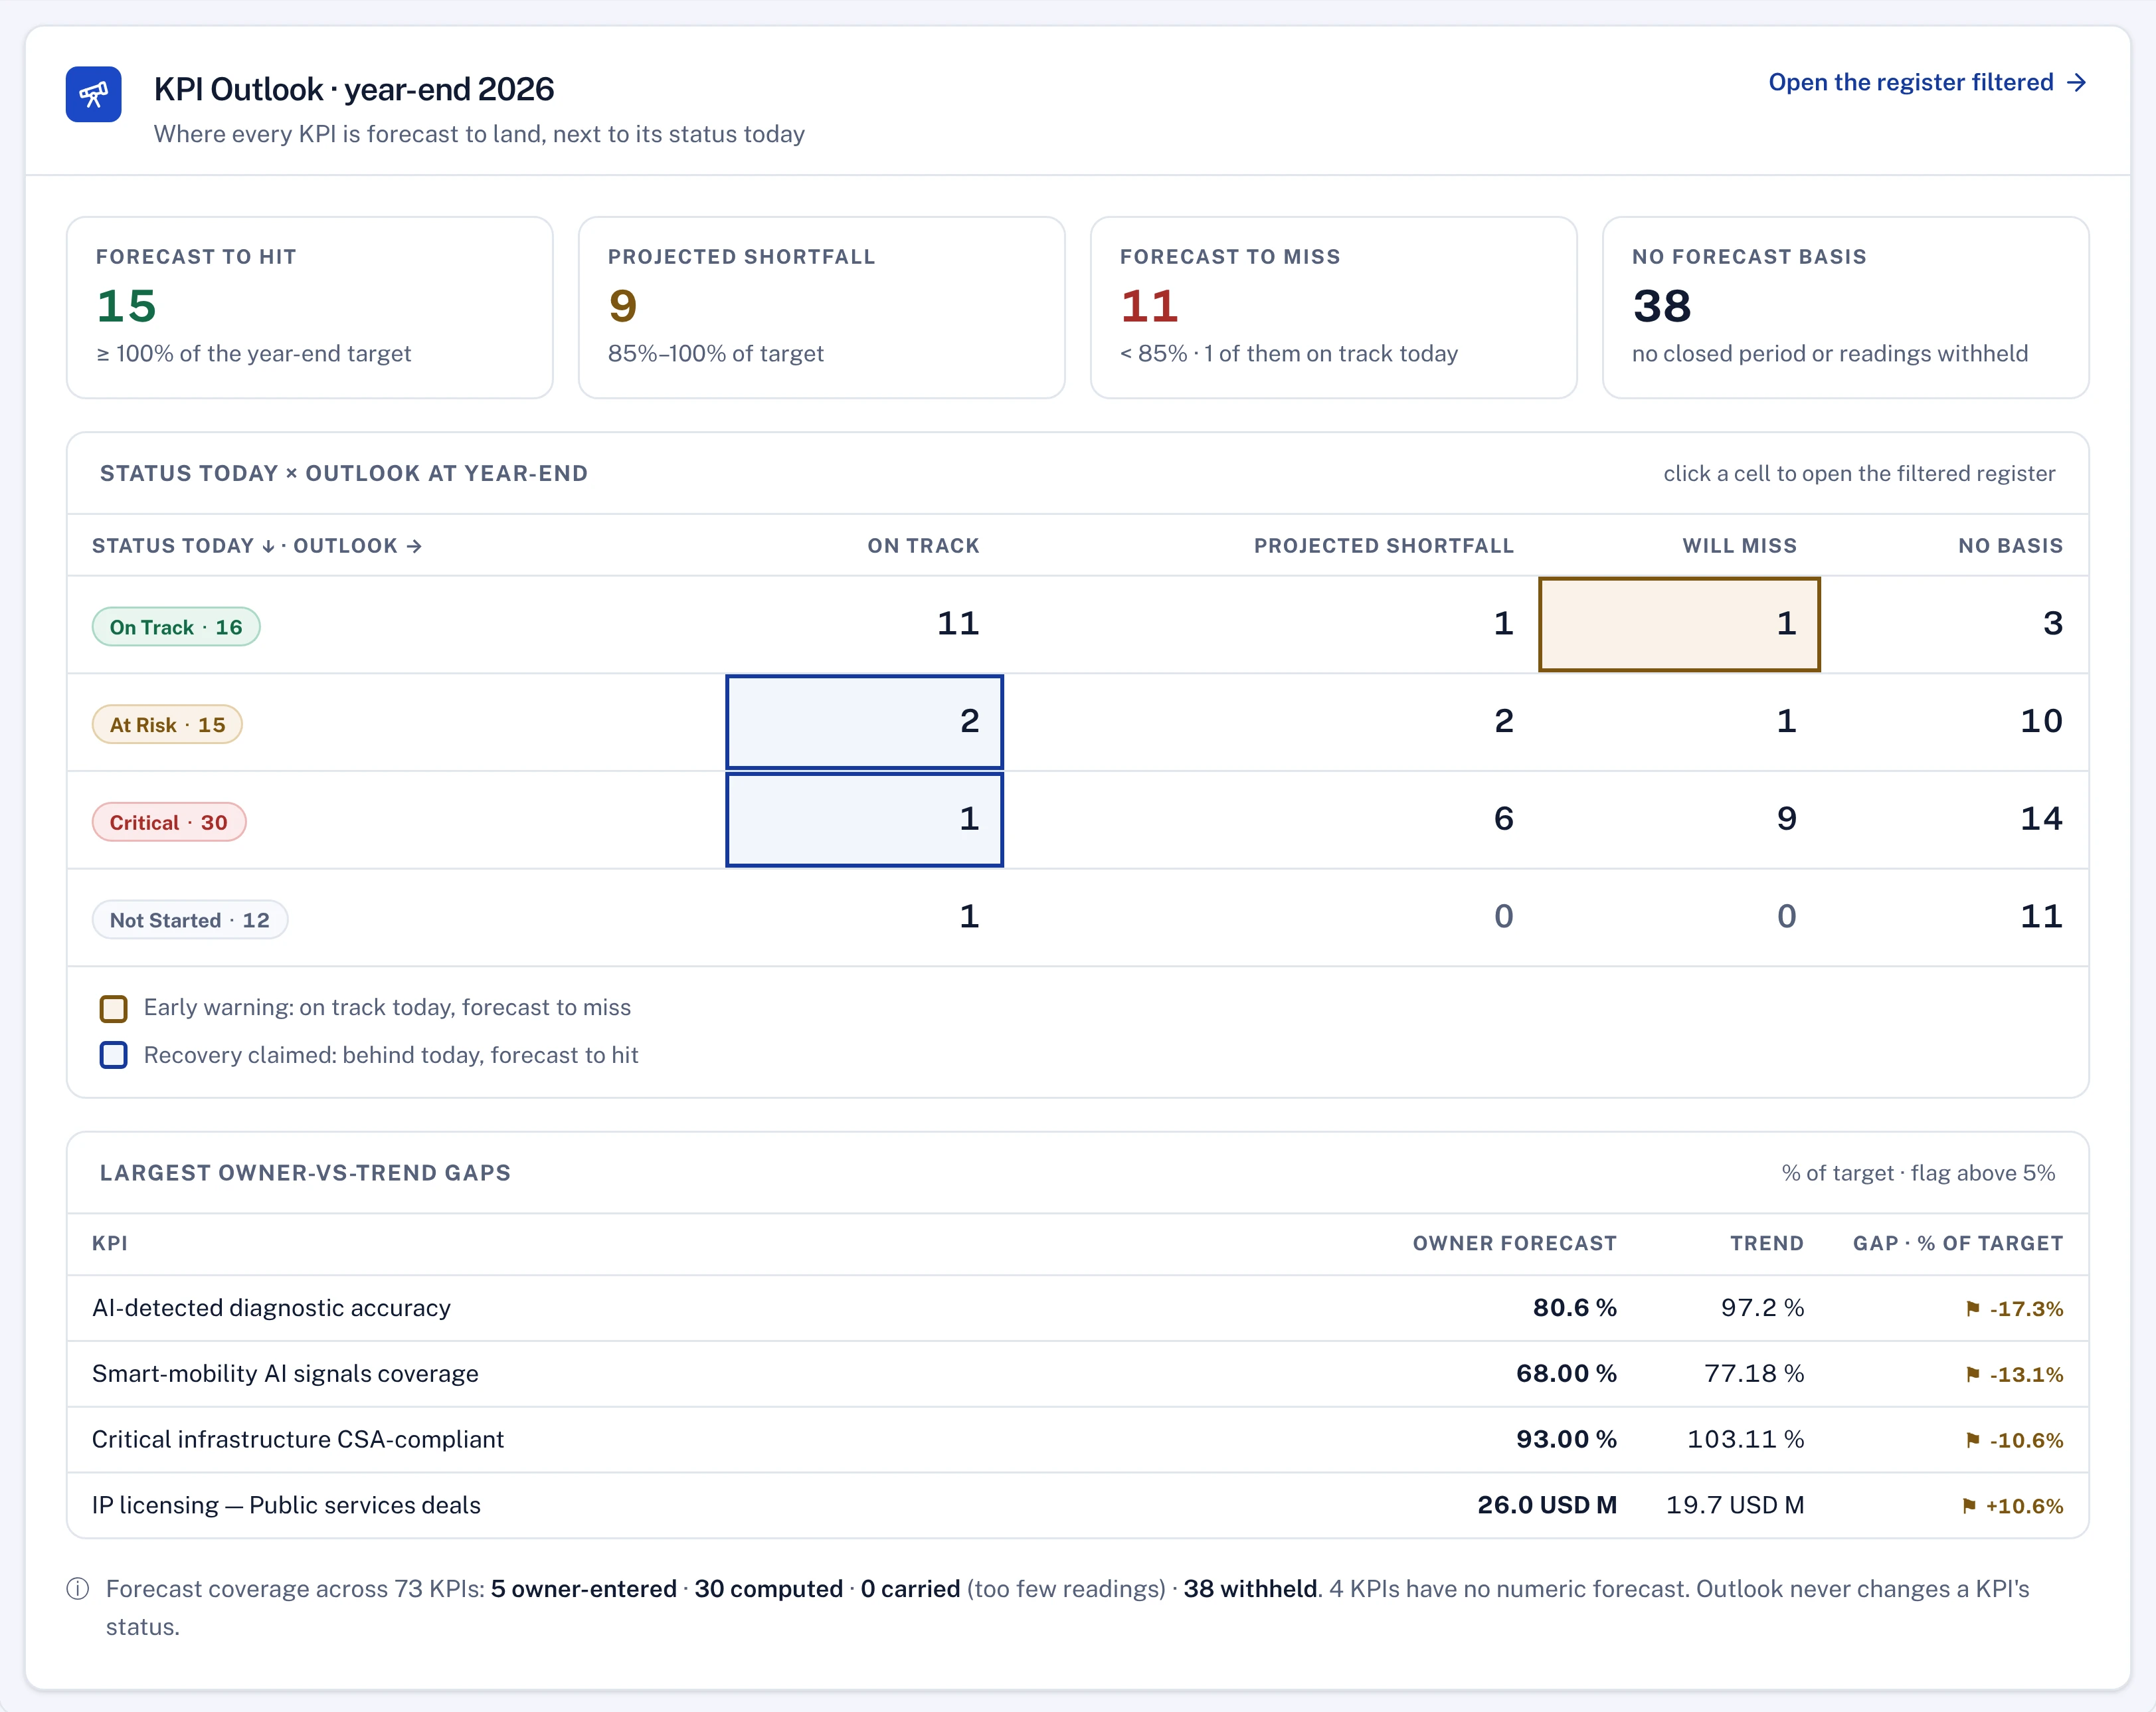
    The KPI outlook sorts every KPI by where it will land at year end, including the ones that look on track today but are forecast to miss.

    • Forecast to hit, projected shortfall and will miss
    • Owner forecast against the computed trend
    • One click to the KPIs behind each number
    KPI outlook: KPIs forecast to hit, fall short or miss, and the largest forecast gaps
    KPI outlook. Where every KPI is forecast to land.

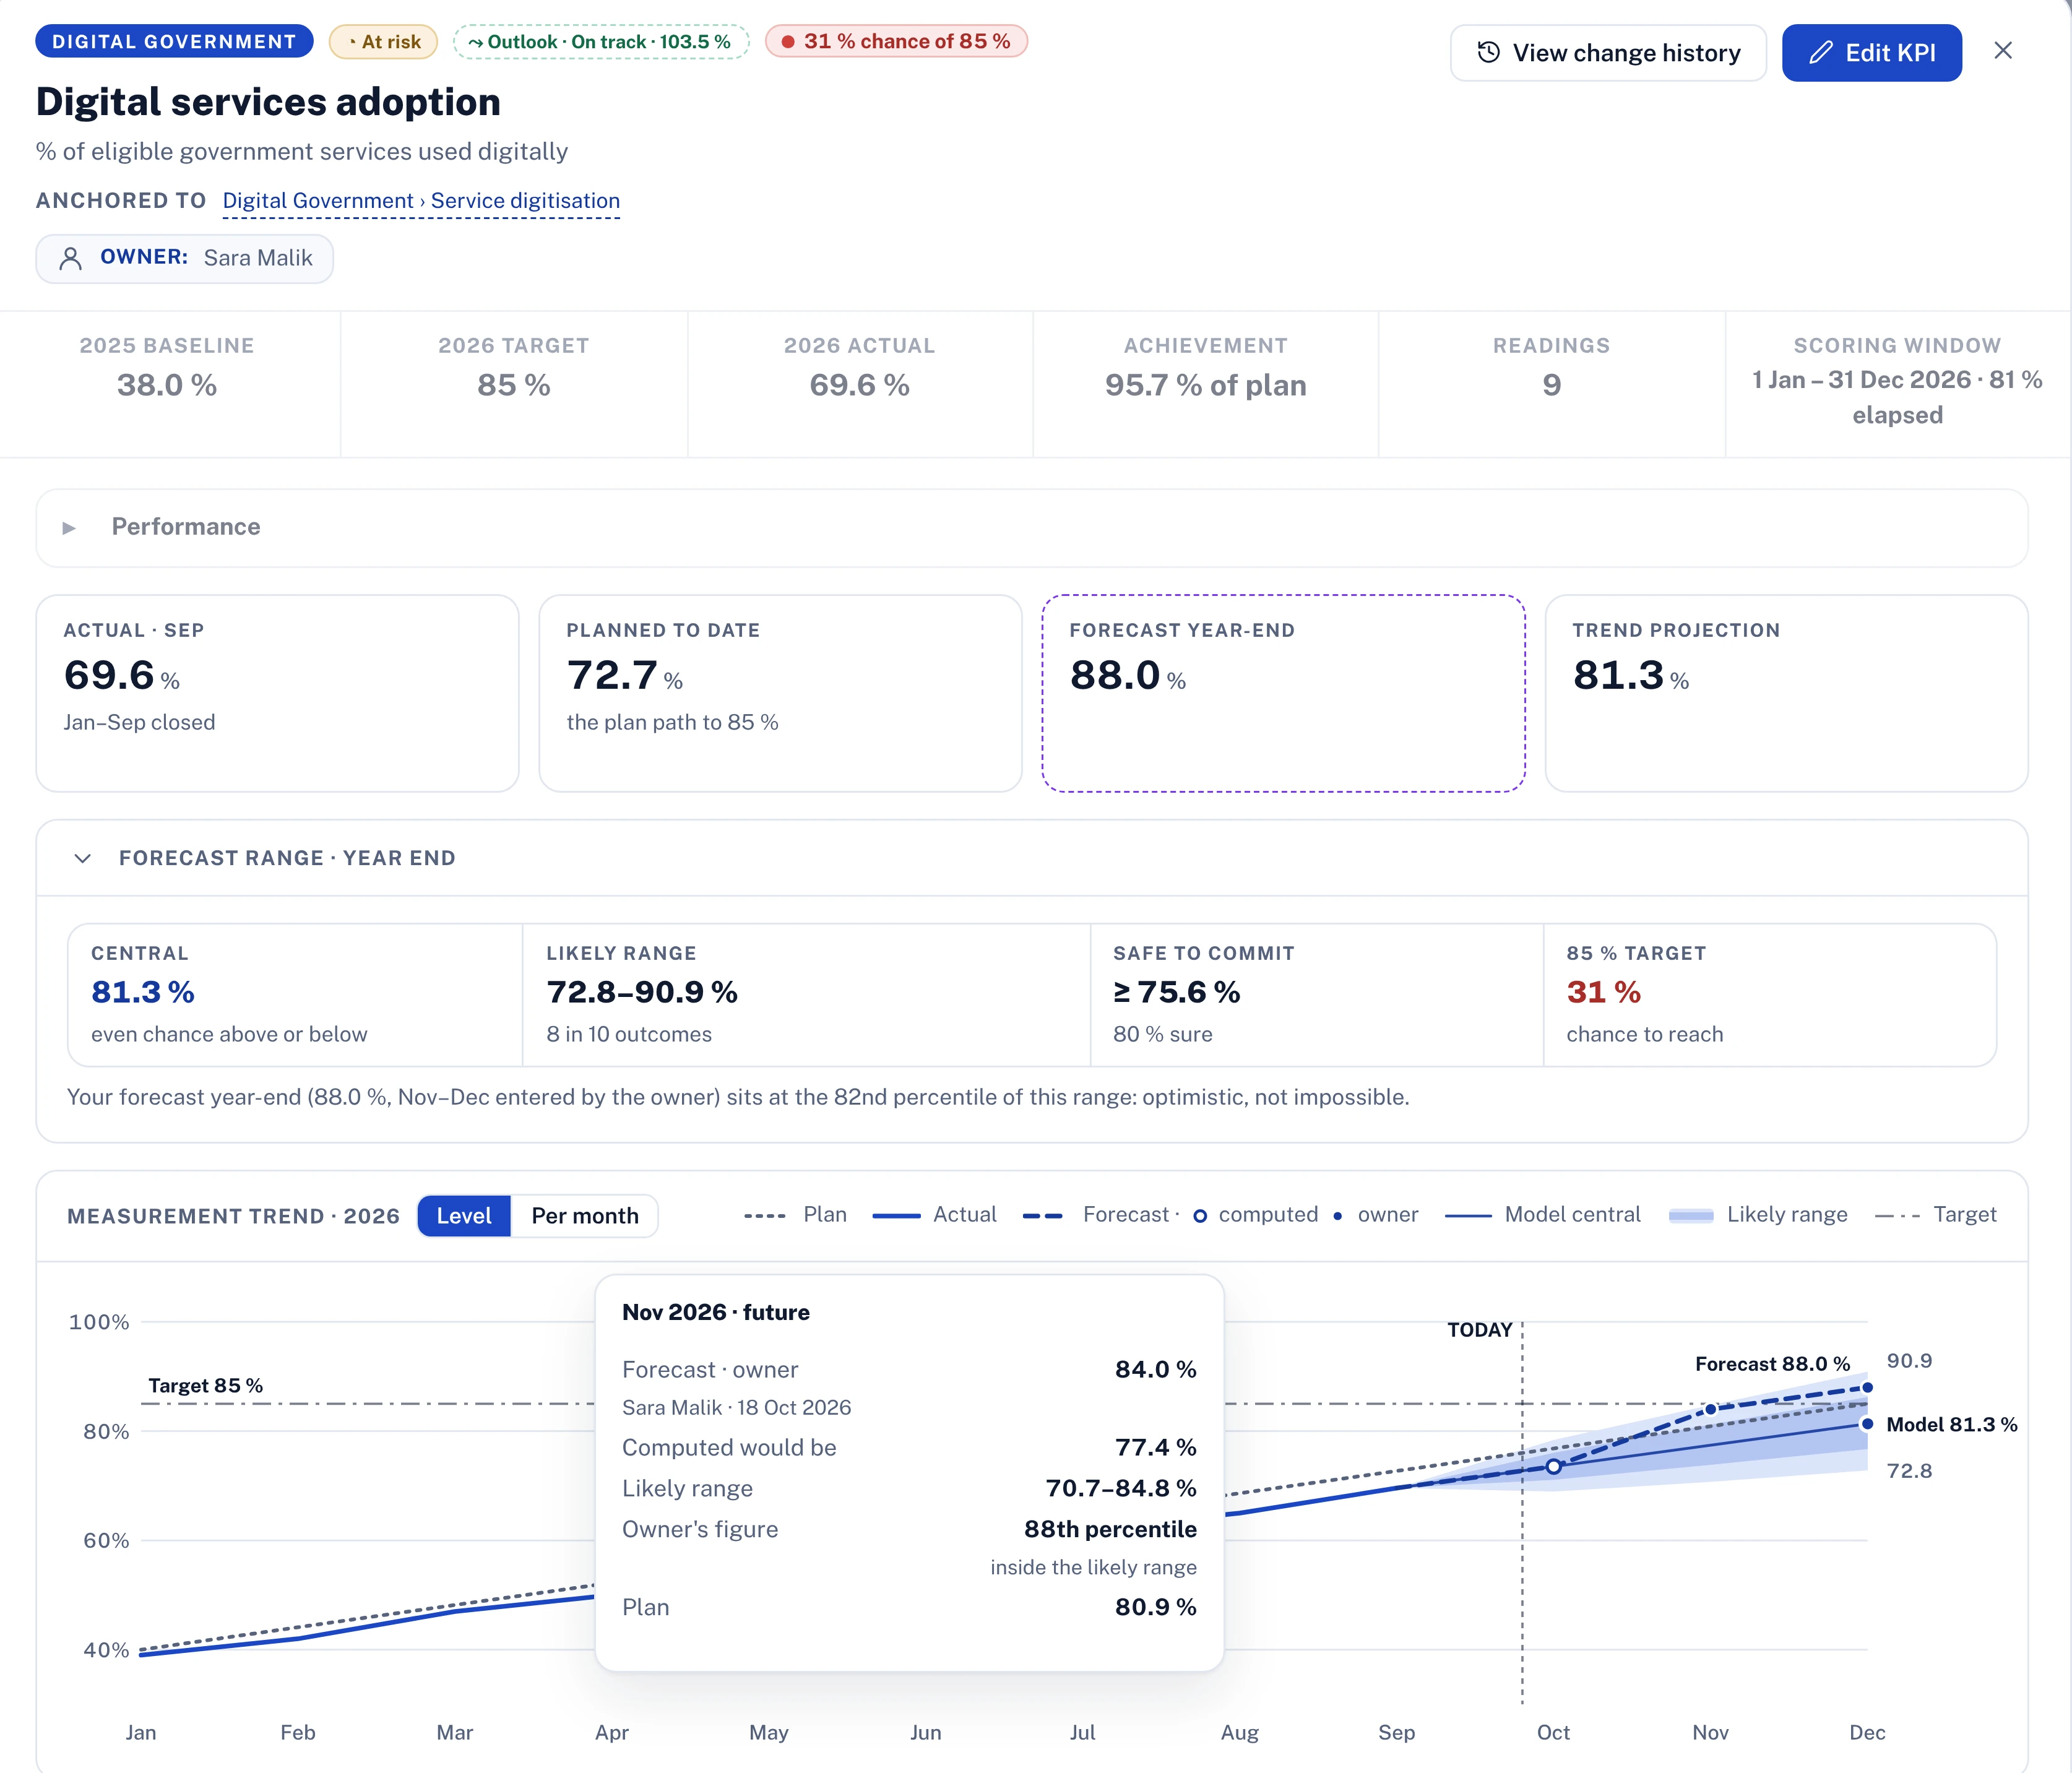
    Every KPI in depth: baseline, target, plan, actual and forecast

    Each KPI keeps its baseline, its target, the plan to date, every reading and where it is forecast to land, with the owner's own forecast beside the computed one. Monthly or quarterly targets can follow a phased plan, so a seasonal KPI is judged against its own month, not a straight line.

    • Baseline, target, actual and achievement against plan
    • Phased monthly or quarterly targets
    • Owner forecast beside the computed trend
    KPI deep-dive: baseline, target, actual, achievement, plan to date, forecast year-end and trend projection, with the measurement trend chart
    KPI deep-dive. Baseline, target, plan, actual and forecast for one KPI, with its trend.

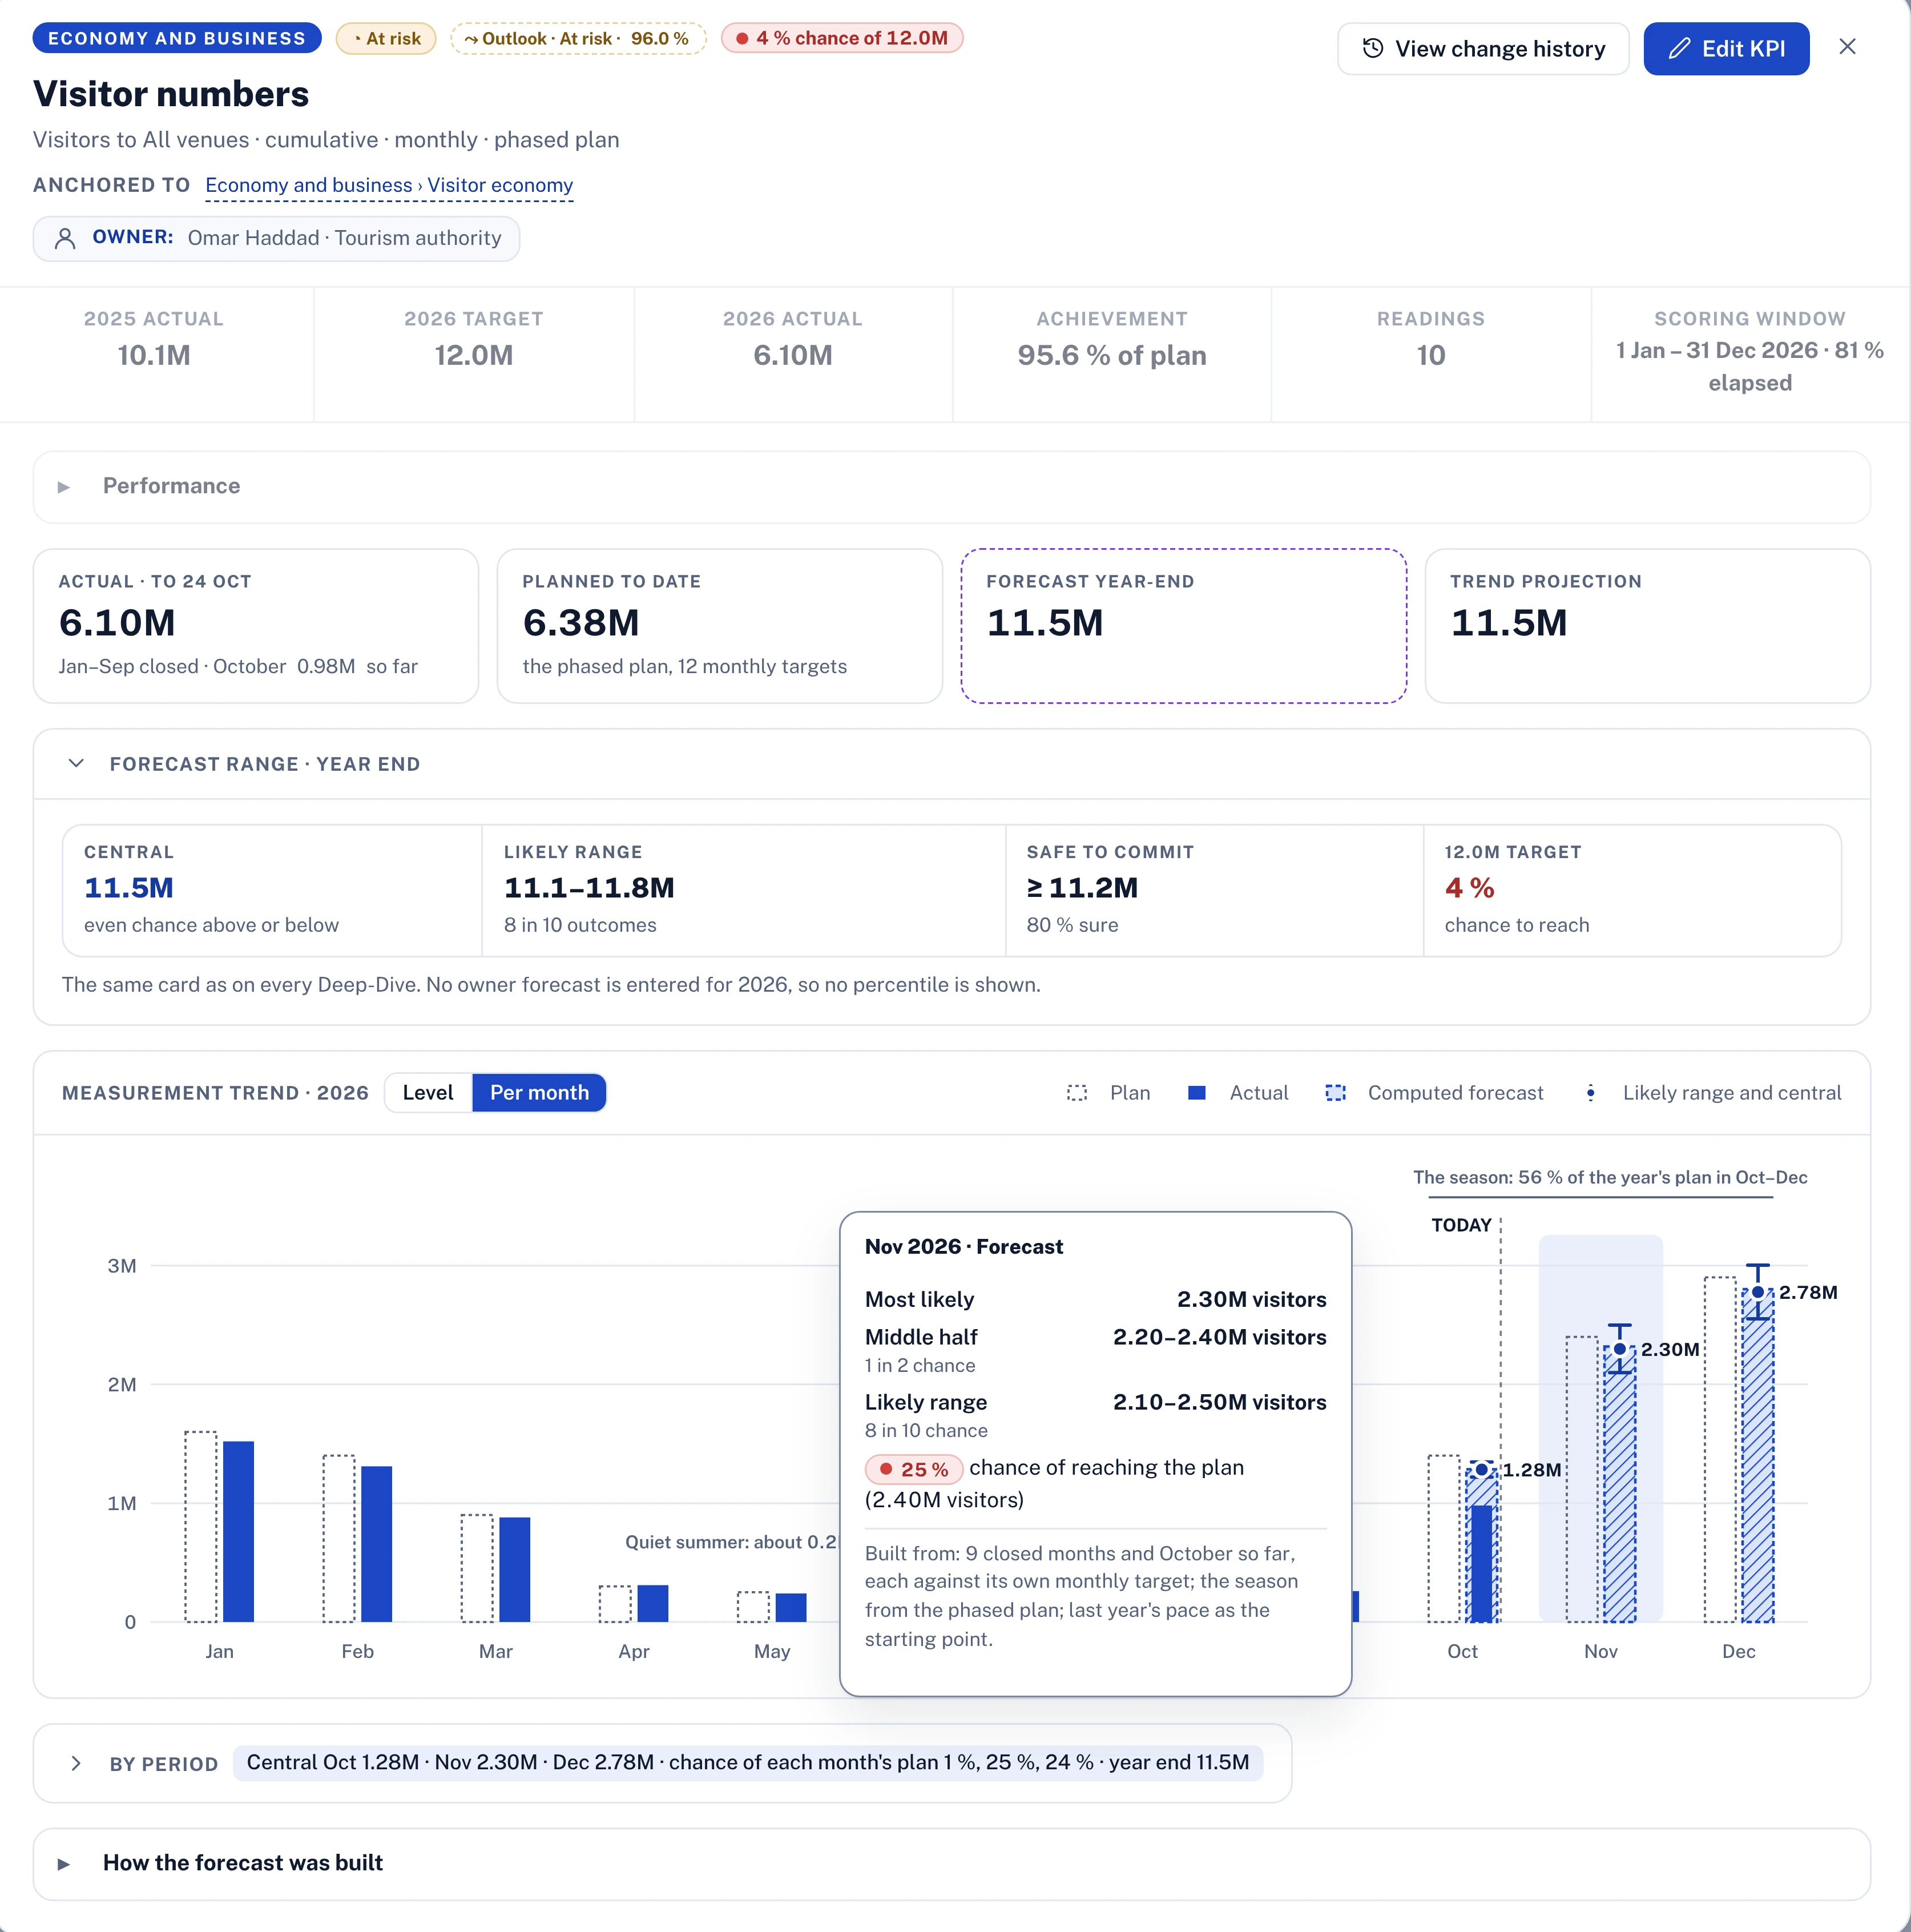
    AI forecasts with a likely range

    Polaris forecasting adds a range to every KPI: a central estimate, the likely range, the figure that is safe to commit and the chance of reaching the target, month by month. It shows how the forecast was built, so the owner can challenge it.

    • Central estimate and likely range
    • Chance of reaching the target
    • Month-by-month forecast against a phased plan
    KPI forecast by month against a phased plan: actuals, computed forecast bars with a likely range, and the chance of reaching each month's plan
    AI forecast by month. Each month against its own plan, with the likely range and the chance of reaching it.

    What you get

    Every item runs on the same engines the screens use.

    Strategy map

    Vision, mission, pillars and initiatives on one page, with progress.

    KPI cascade

    Strategic to team KPIs, linked so progress rolls up.

    KPI register

    Every KPI with its owner, status, year-to-date and forecast.

    Evidence

    The documents each reading needs, attached to the reading.

    Value lines

    Benefits tracked as revenue, cost and EBITDA lines against target.

    Weighted roll-up

    By effort or budget, with the basis always shown.

    Polaris in strategy and kpis

    The advisors and agents that work in this part of the platform. All agents

    Seven chief advisors

    Advises

    Financial, strategy and planning, people, risk, performance, commercial and digital: each reads the programme from its own seat every cycle.

    Reads
    Schedule, budget, KPIs, risks, people
    Produces
    A brief with ranked, priced moves

    Chief of Staff

    Advises

    Reads all seven briefs, reconciles where they disagree, and writes the one page leadership acts on.

    Reads
    The seven chief briefs
    Produces
    Verdict, decisions owed, top moves

    Insight miners

    Watches and drafts

    Run on a schedule looking for patterns: stalled work, burn ahead of progress, greens without evidence.

    Reads
    The whole programme
    Produces
    Findings in the AI findings list

    Key takeaways

    Watches and drafts

    Drafts the key takeaways for an initiative or pillar for its owner to edit.

    Reads
    The initiative or pillar
    Produces
    A draft for the owner

    Questions

    Can we keep our own KPI framework?

    Yes. Levels, units, cadence, scoring rules and the cascade structure are configured, not coded, so your framework becomes the working system.

    Where do the actual readings come from?

    Owners enter them, or they arrive from connected systems such as the finance system. Either way each reading carries its source and its evidence.

    How is the forecast calculated?

    From the readings so far and the plan for the remaining periods. Owners can also enter their own forecast, and the two are shown side by side.

    See it on your own programme.

    Send us a slice of your portfolio and we load it before the session, from strategy down to task.