Run the value creation plan, not a status pack
Lodestar holds the value creation plan as a live model: every initiative posting to a value line, every claim evidenced, every portfolio company on the same definitions, with a separate workspace for each company.
How it works
For deal teams, operating partners and portfolio-company value creation offices running a plan against a hold clock.
The value bridge is the plan, not a slide
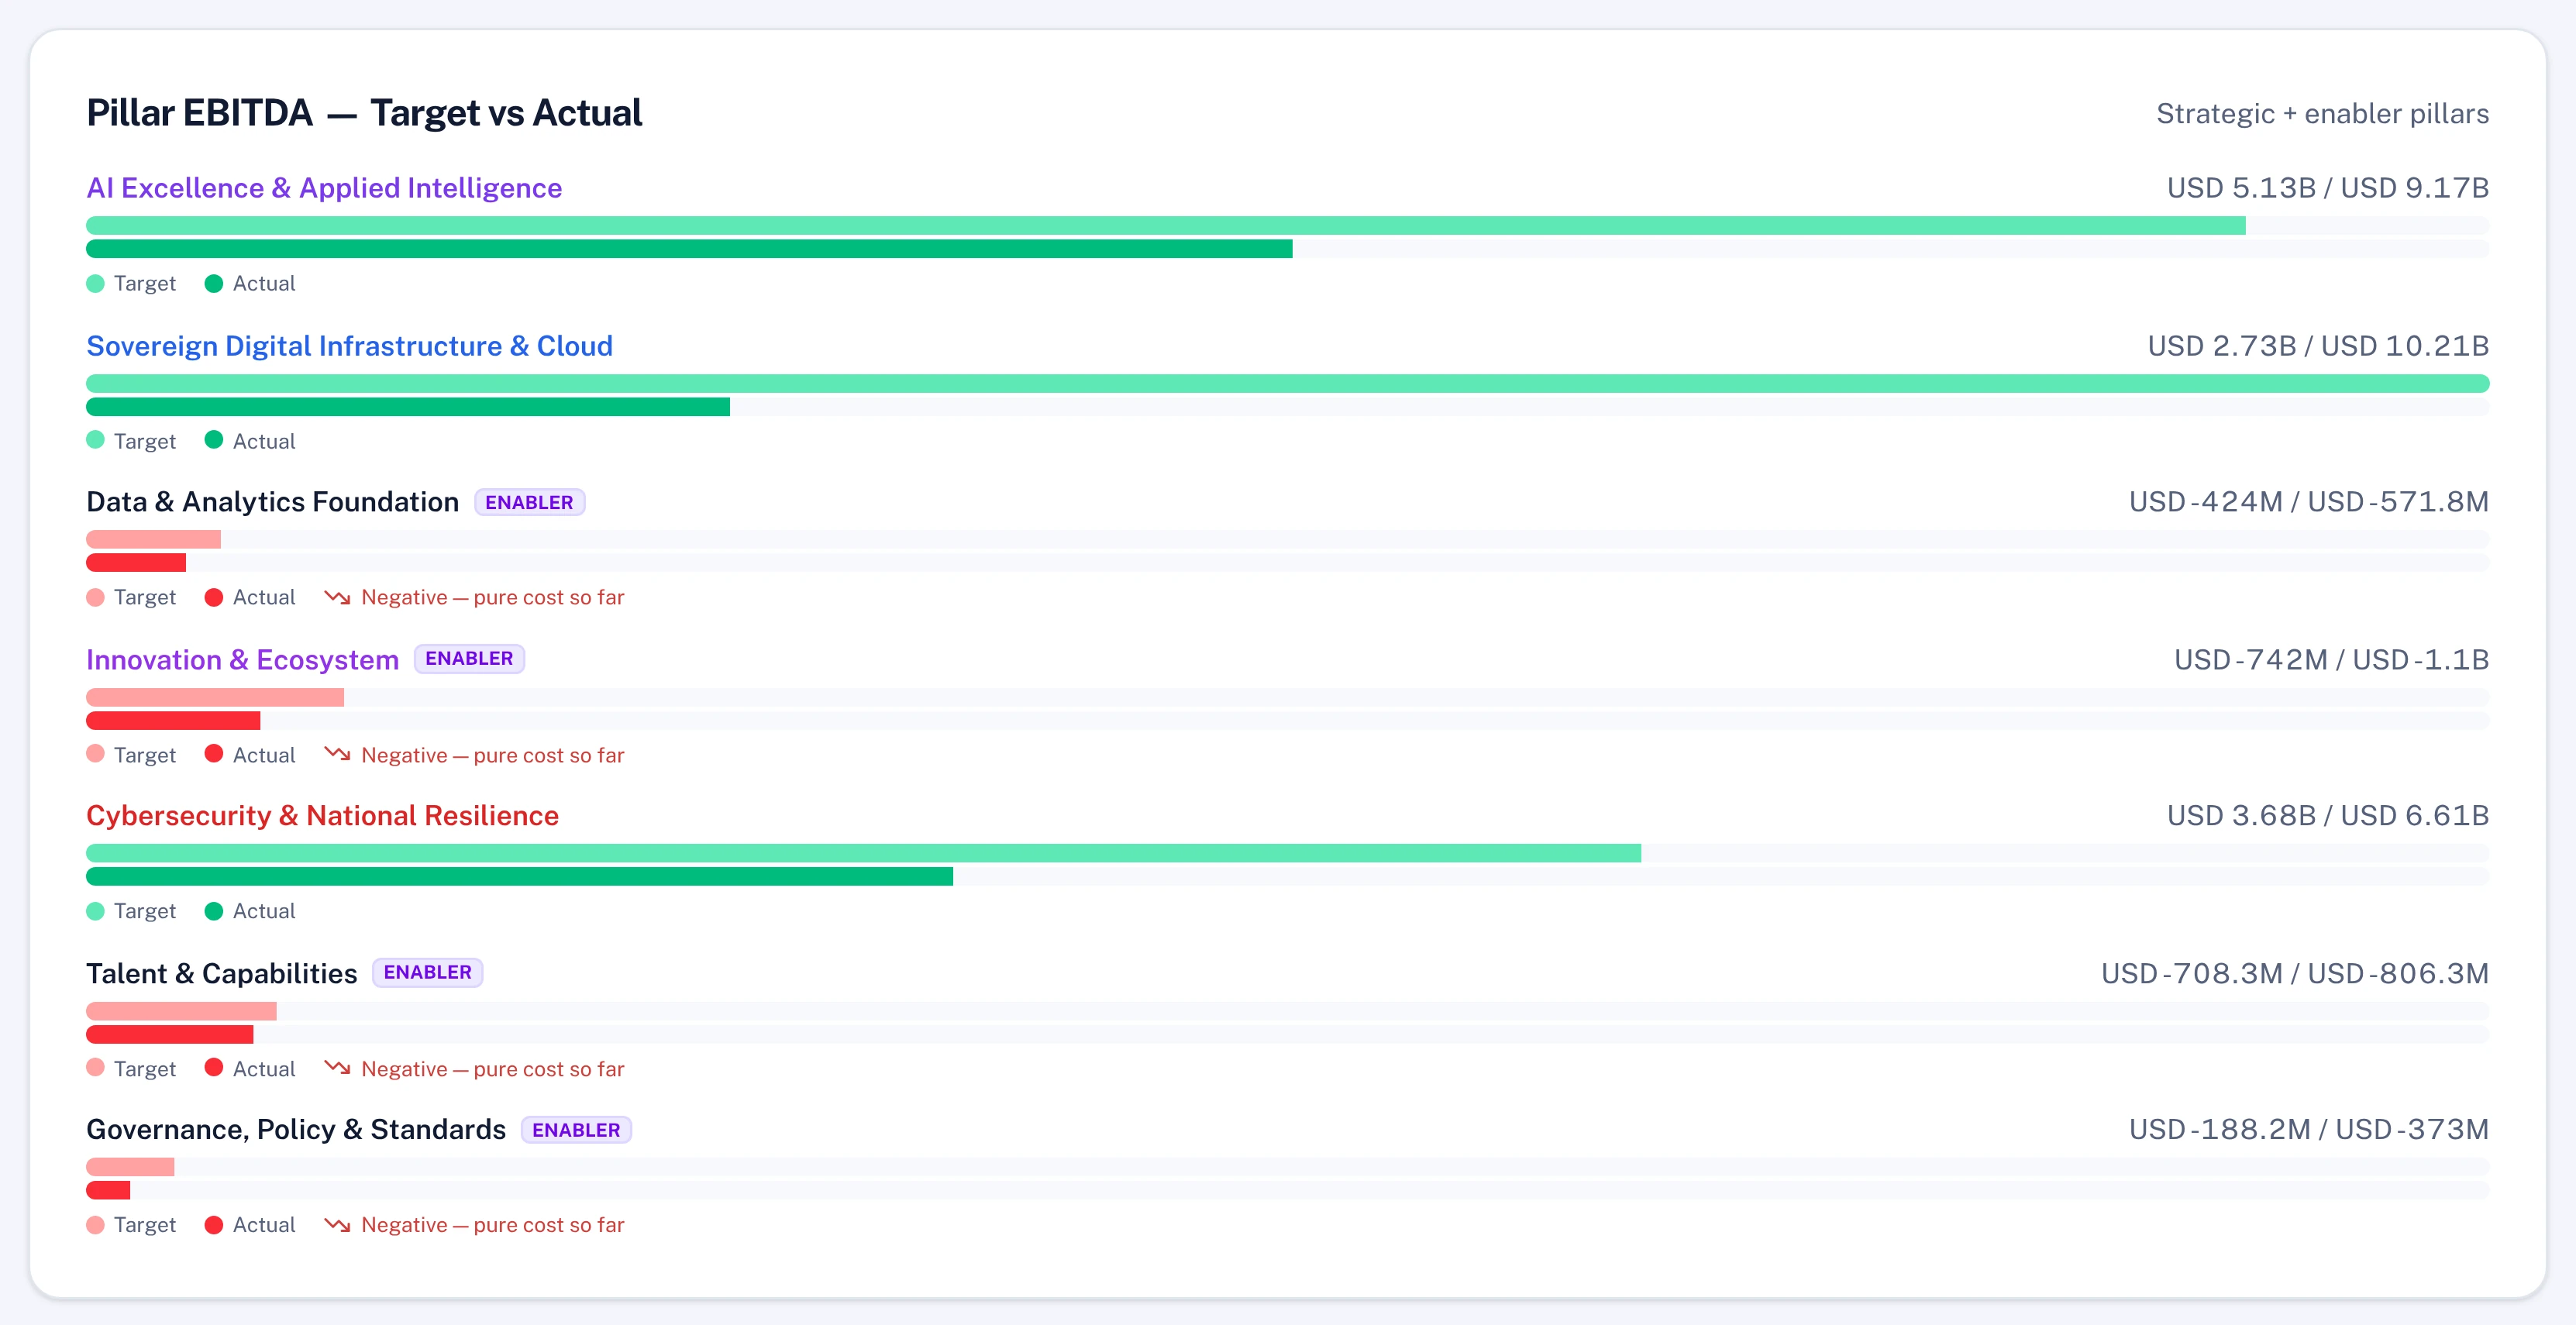
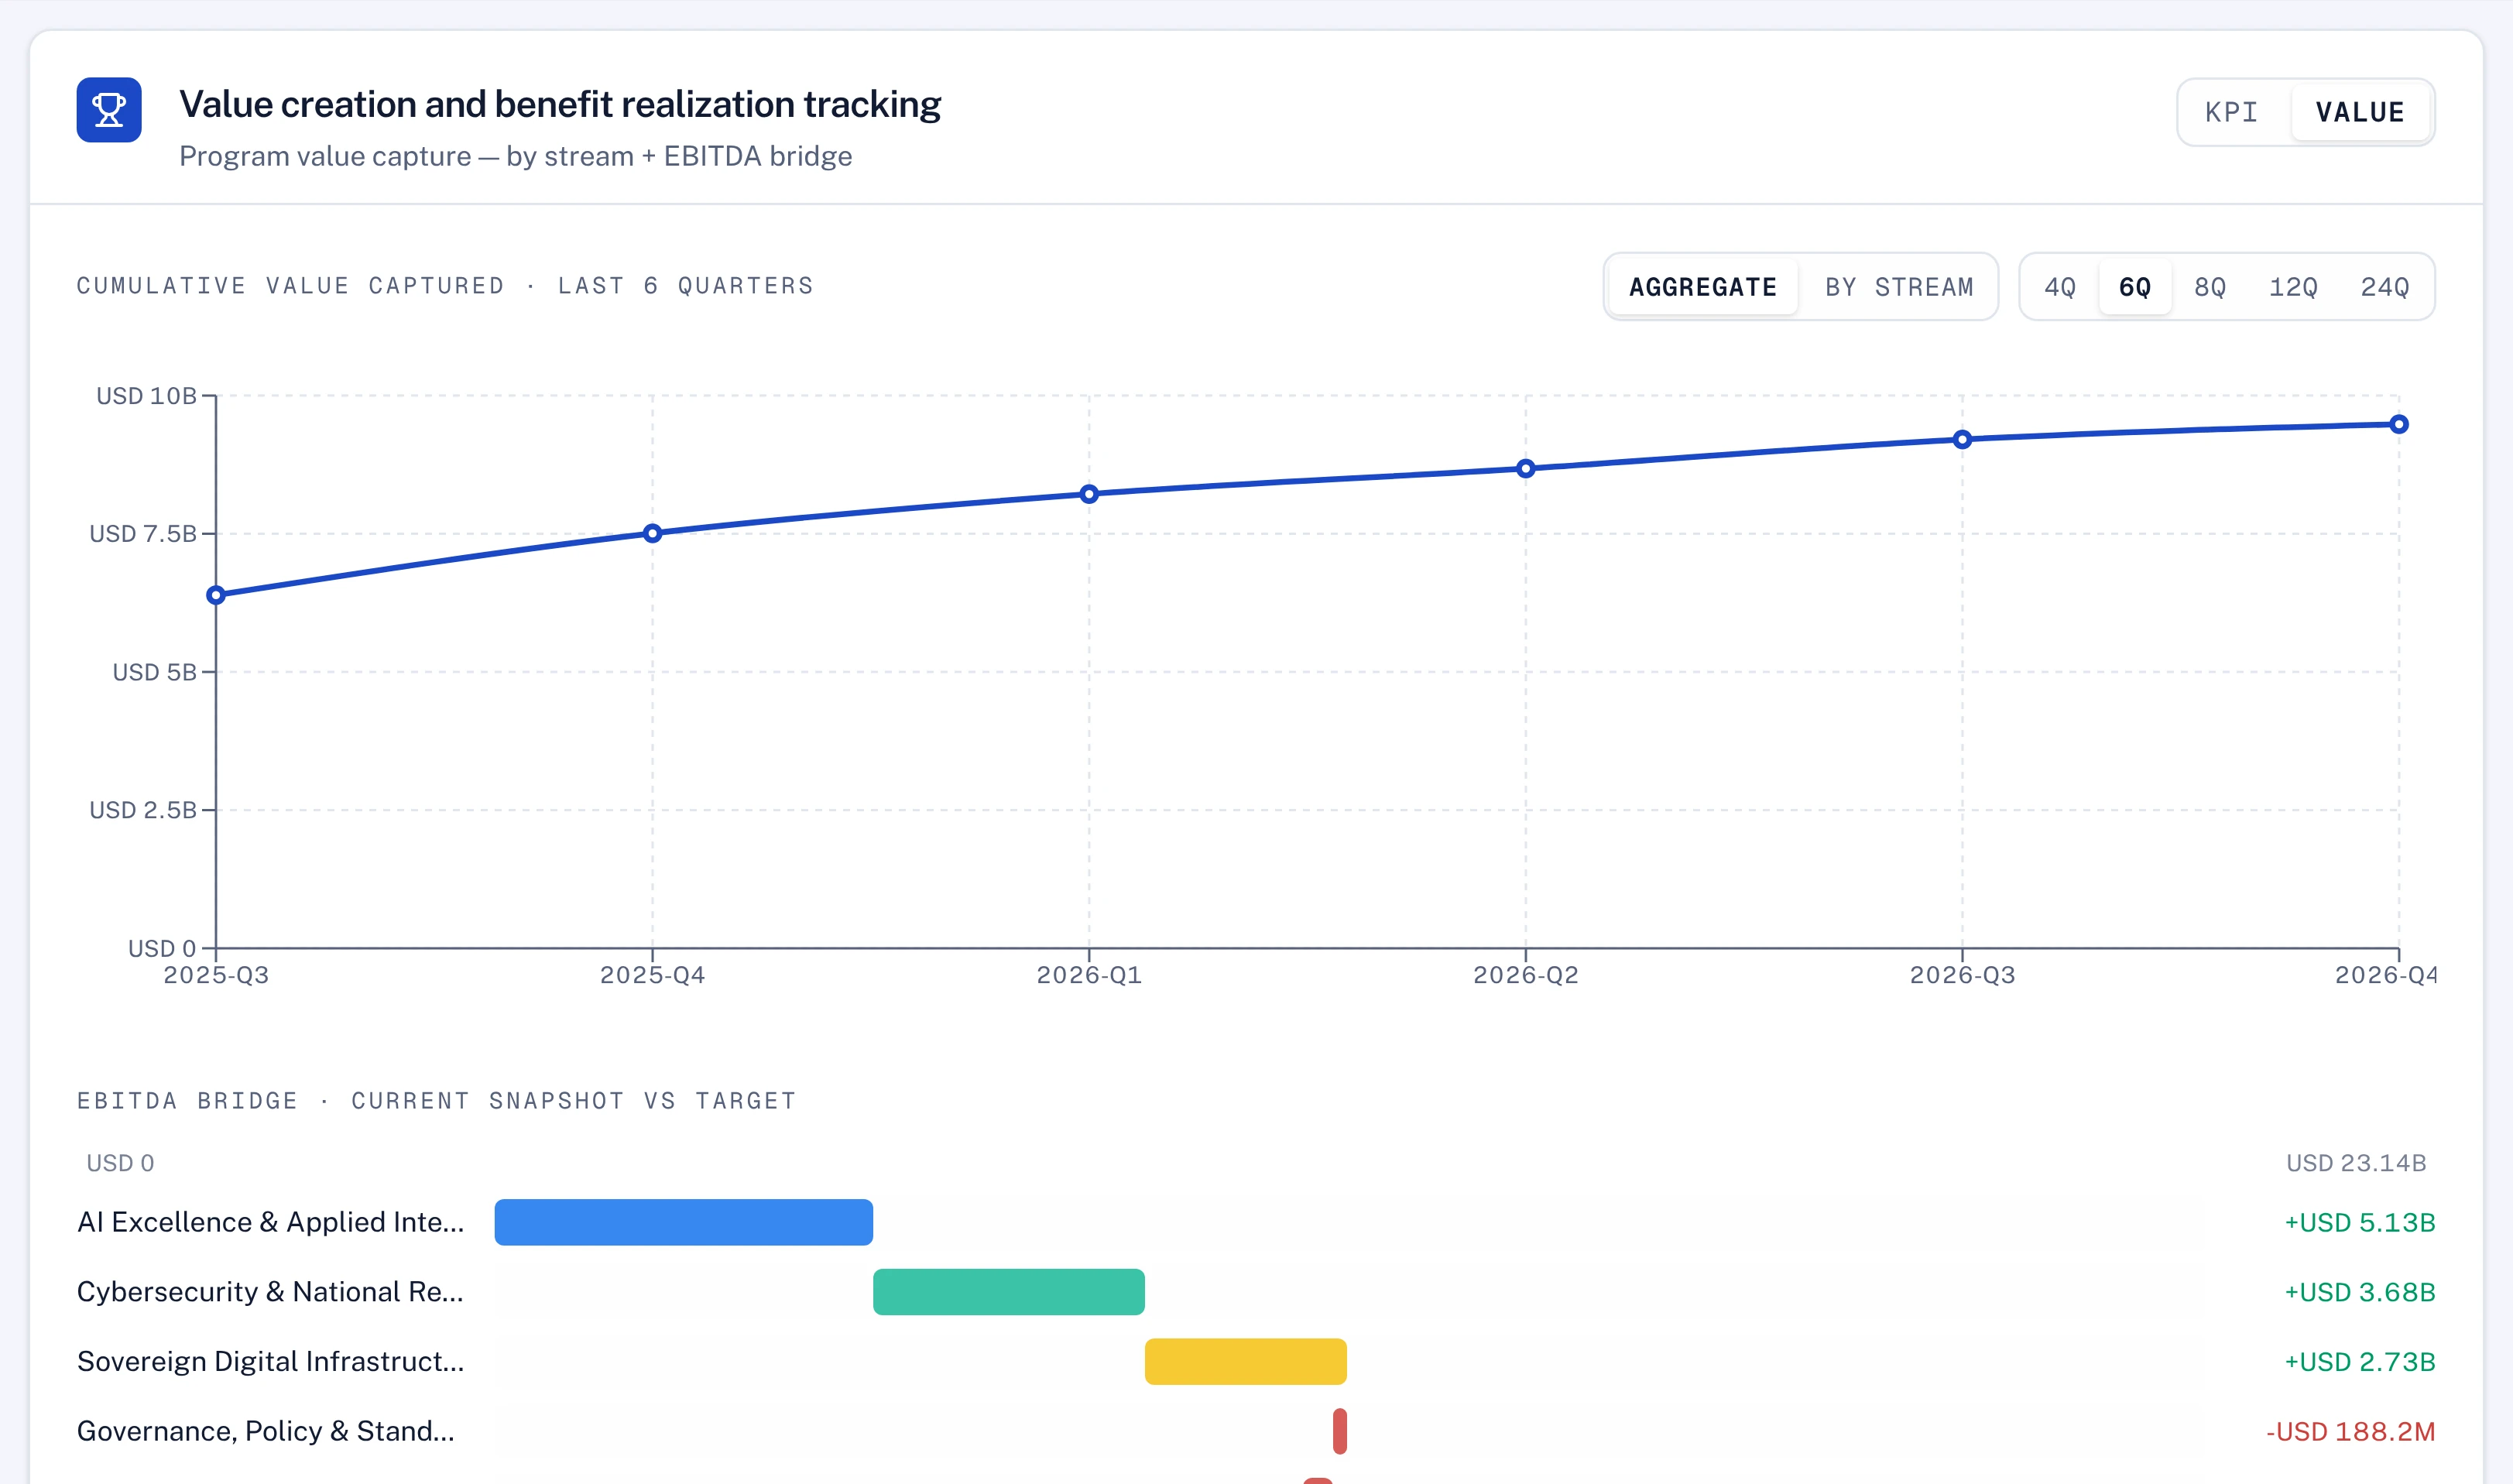
Every initiative posts to a value line, such as pricing, cost-out, volume or leakage, with target, actual and direction per line. The run-rate from entry to exit is computed from those lines, so the number in the fund report is the number in delivery.
- Initiative, value line and run-rate impact, with owner and evidence
- Booked, in-flight, at-risk and lost value kept apart
- The bridge rebuilt automatically as dates and actuals move
Value that is claimed but not evidenced does not count
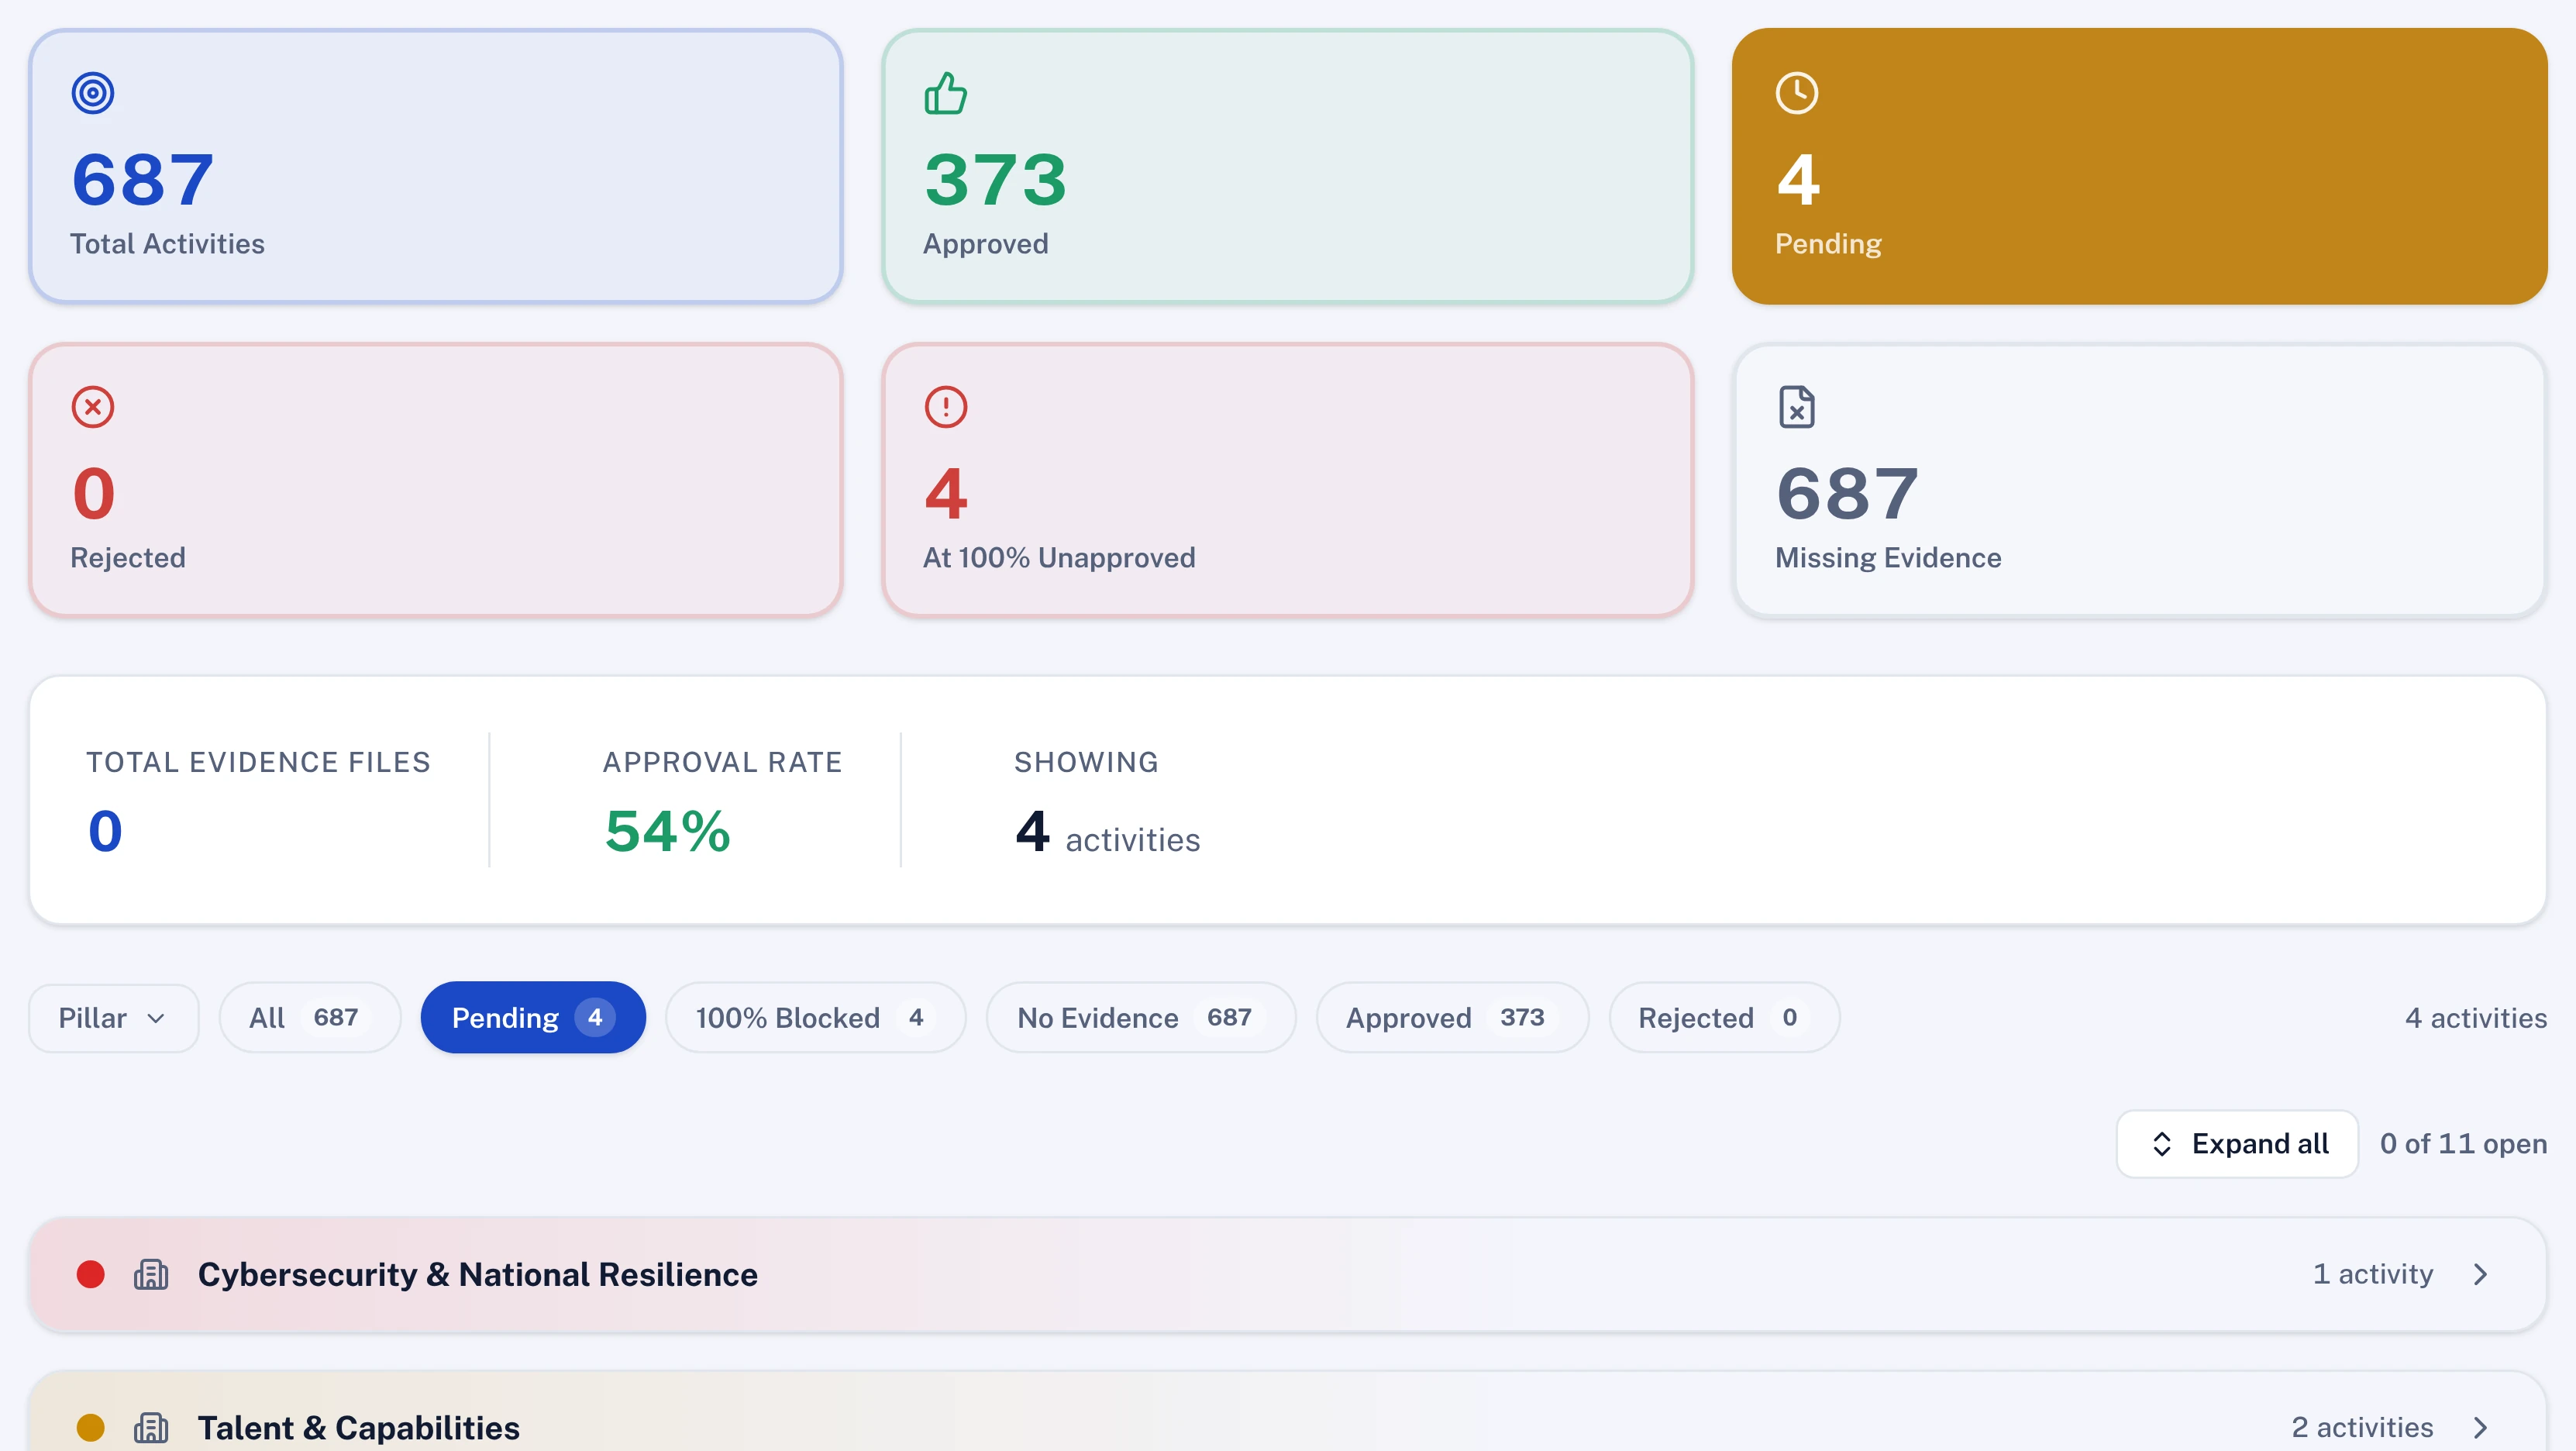
Each initiative carries its measurement method, baseline and evidence requirement. Run-rate is recognised only when the evidence lands, so the operating partner and the CFO stop arguing about definitions.
- Booked against run-rate against pipeline, per initiative and per company
- Evidence cadence enforced before value is recognised
- One-off items kept apart from sustainable run-rate
One lens across the portfolio, each company kept separate
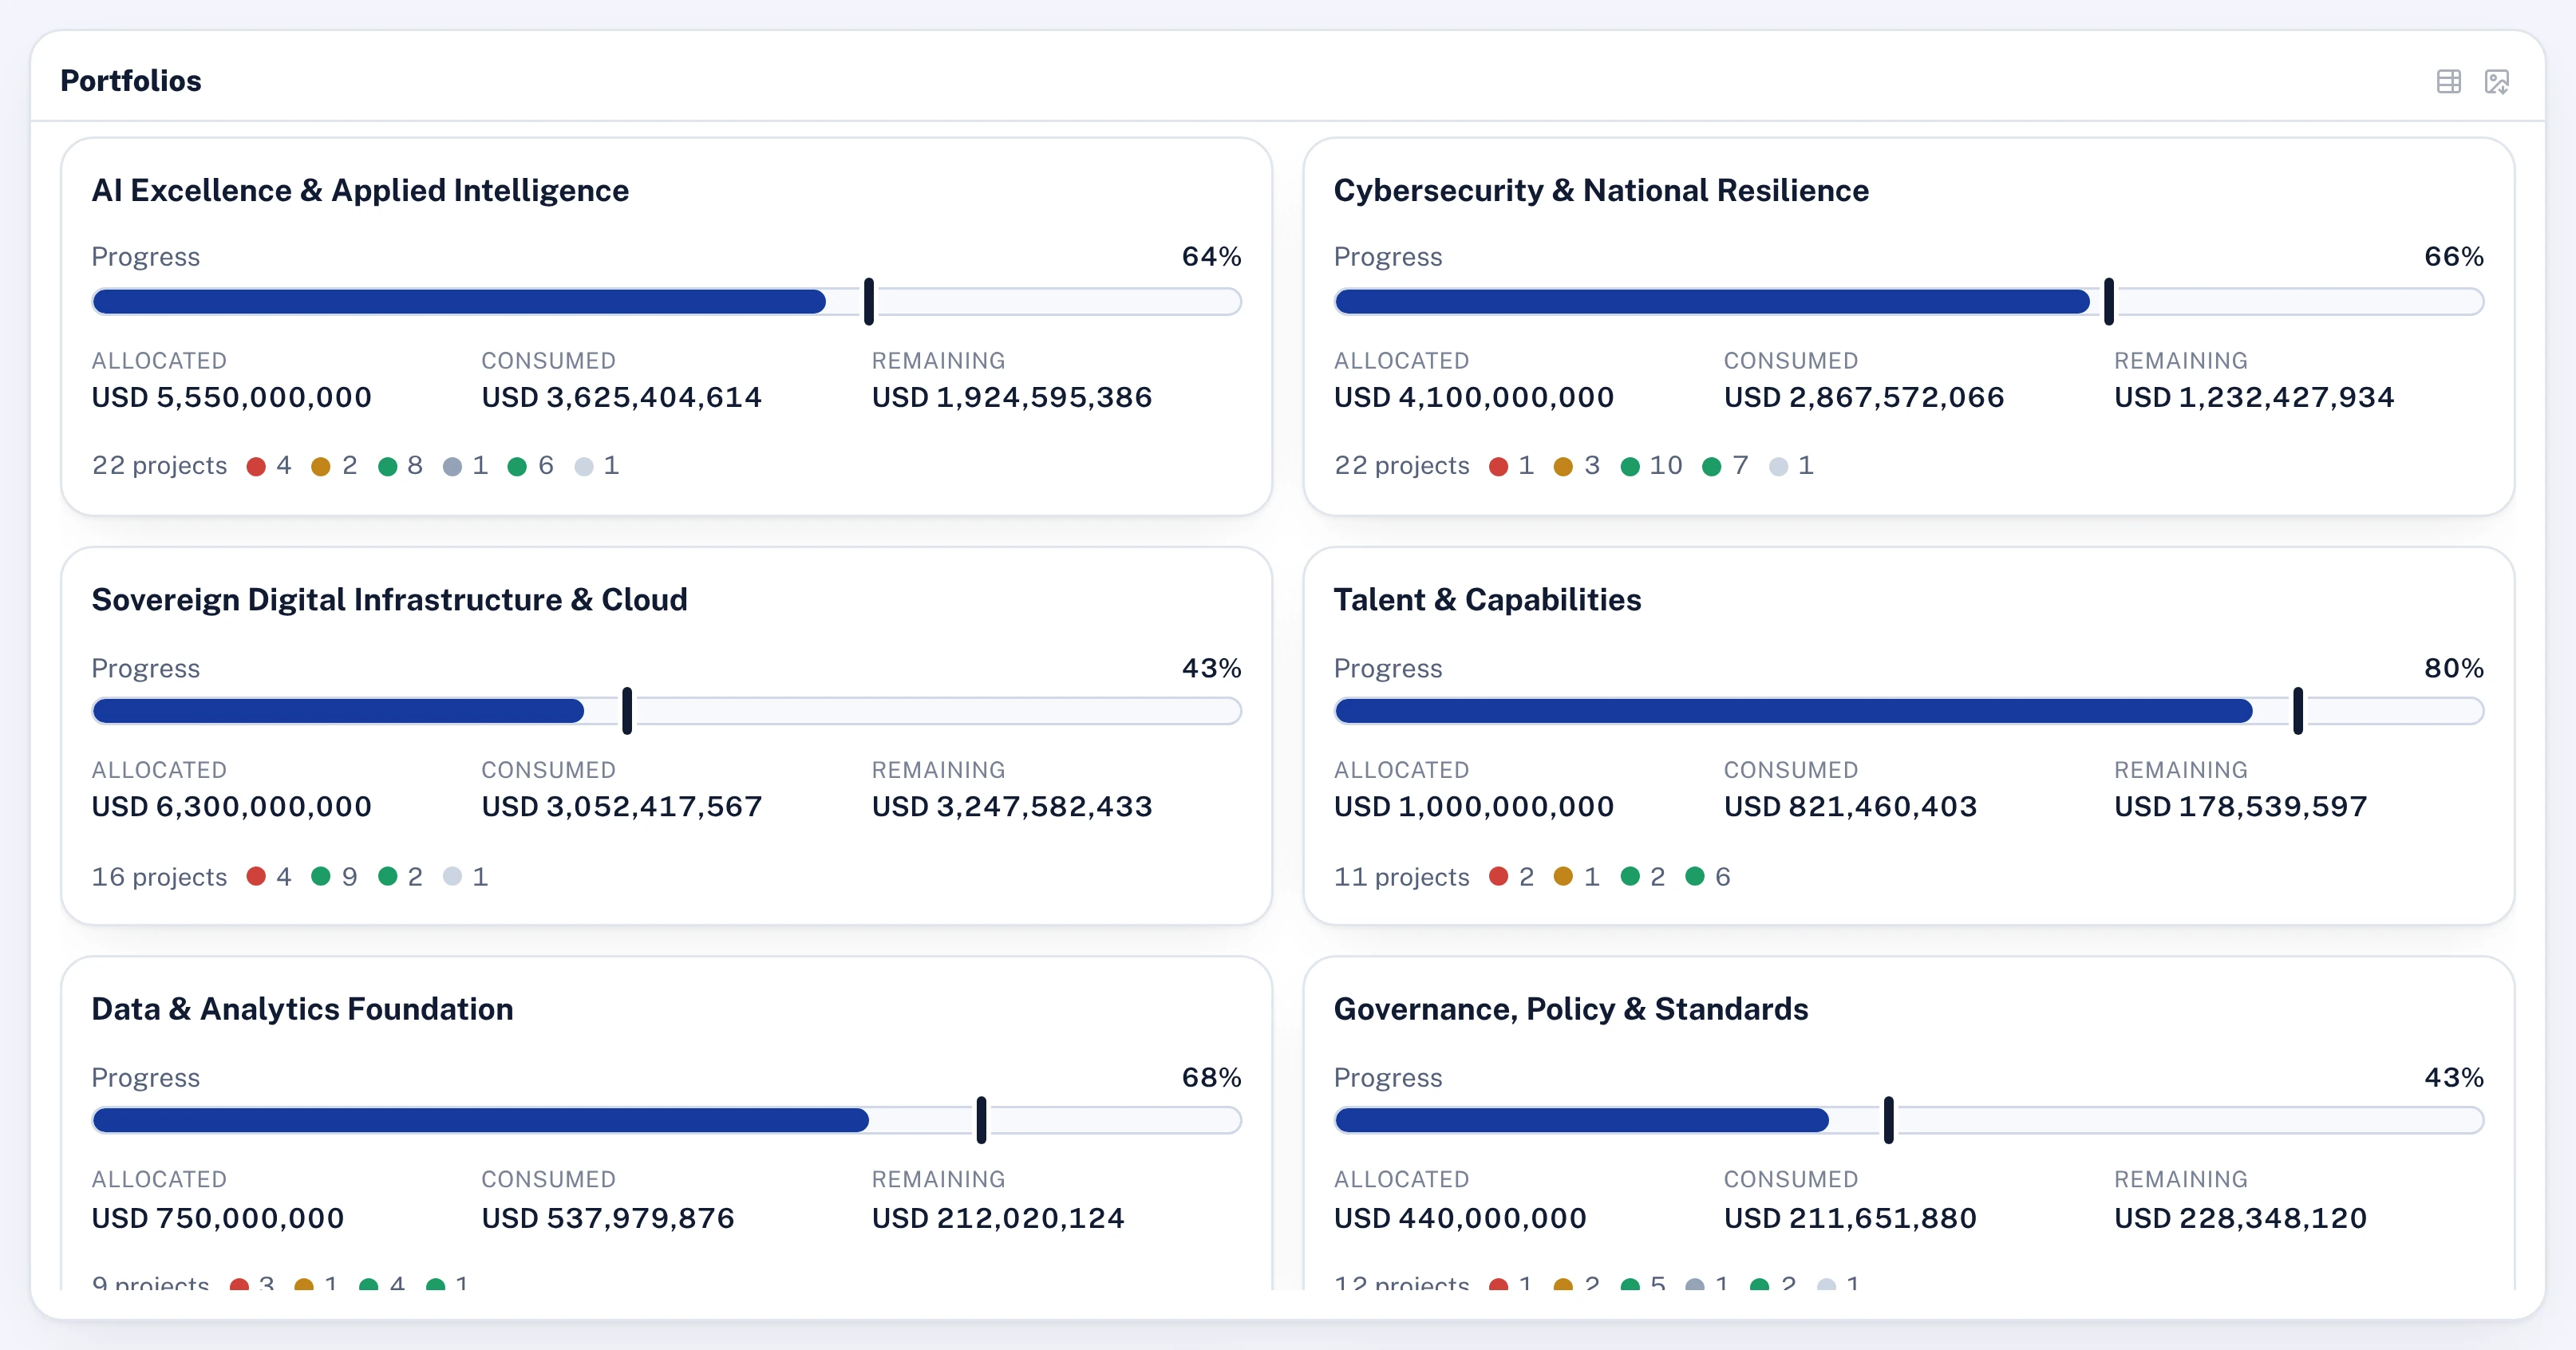
The fund sees every company on the same value-line structure and the same scale. Each management team sees only its own company, in its own workspace, with role-based permissions inside it.
- Comparison across companies on identical definitions
- A separate workspace per company, with permissions inside each
- Hold-period timeline: value at entry, today and projected at exit
The value creation toolkit
Every item below runs on the same engines the screens use, so the numbers never diverge.
Run-rate from entry to exit computed from the value lines, initiative by initiative.
Booked, in-flight, at-risk and lost, each with its method and evidence.
Workstreams, owners and gates from close through the first 100 days.
Every company on identical definitions and one maturity scale.
A separate workspace for each company, with role-based permissions.
A hold-period timeline and an audit trail behind every claim.