↑↓ to moveEnter to openAll results →

    Board reports that write themselves, and dashboards you build yourself

    Lodestar generates the board report, the KPI scorecard and a one-page deep dive for every project from the live numbers, following top-tier strategy consulting practice, in a template tailored to your company. Build your own dashboards beside them, from scratch or from a template.
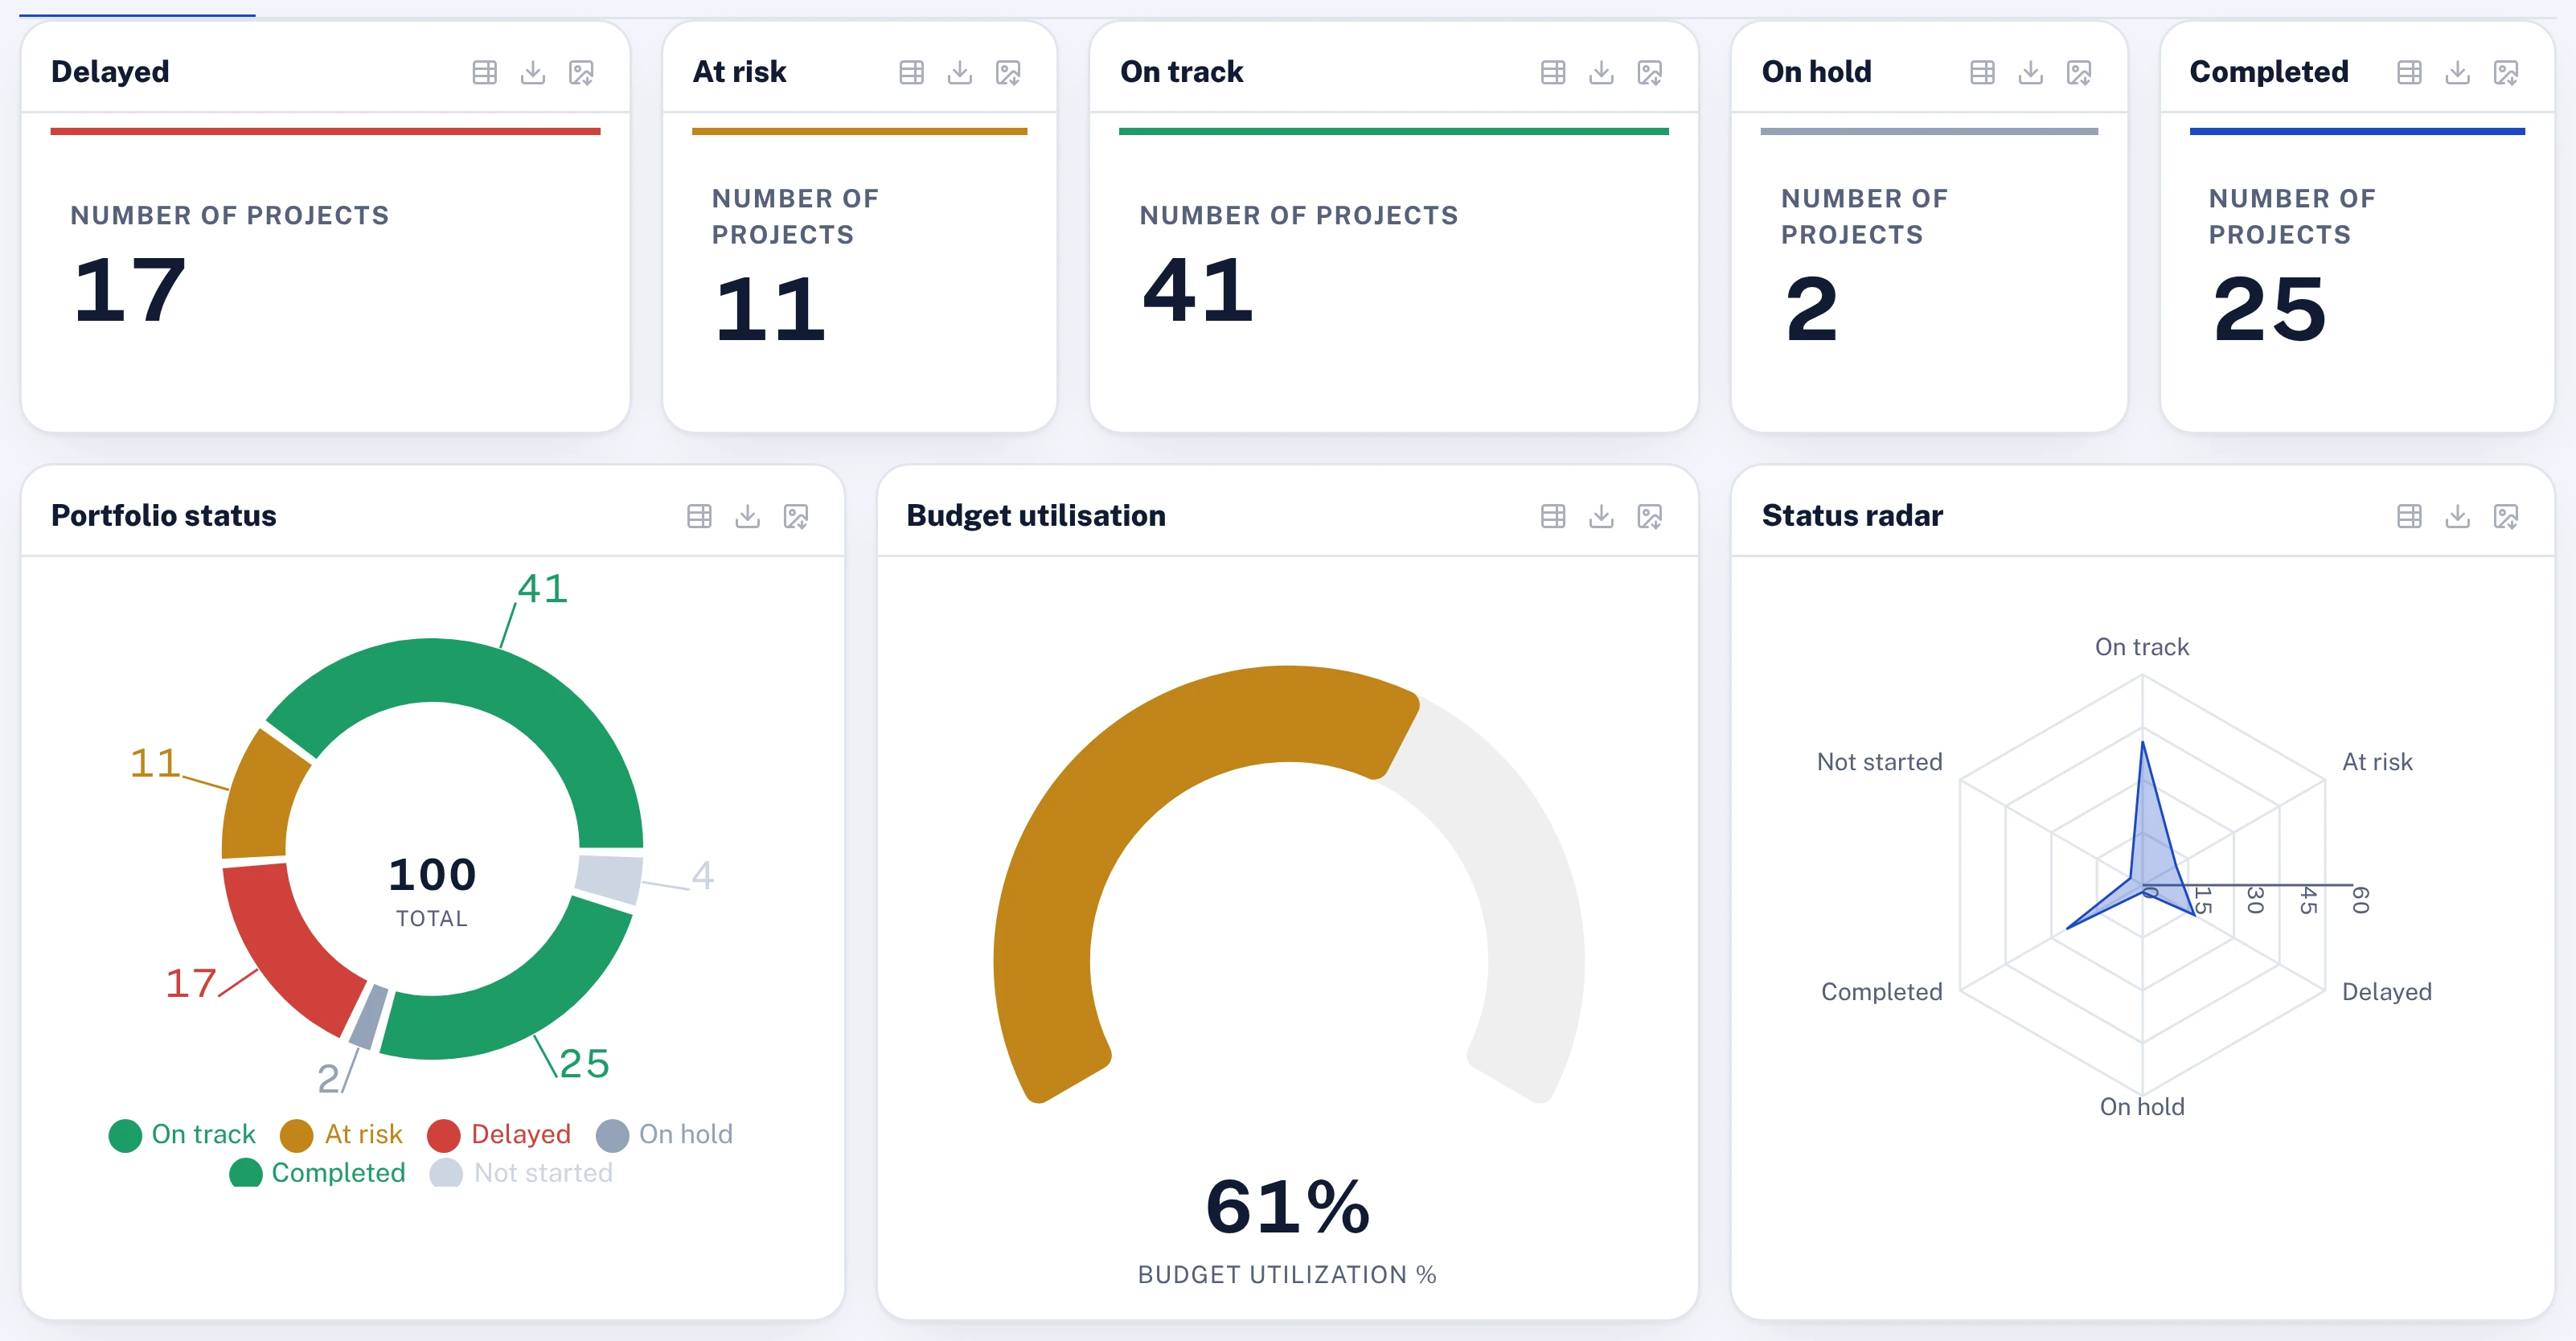
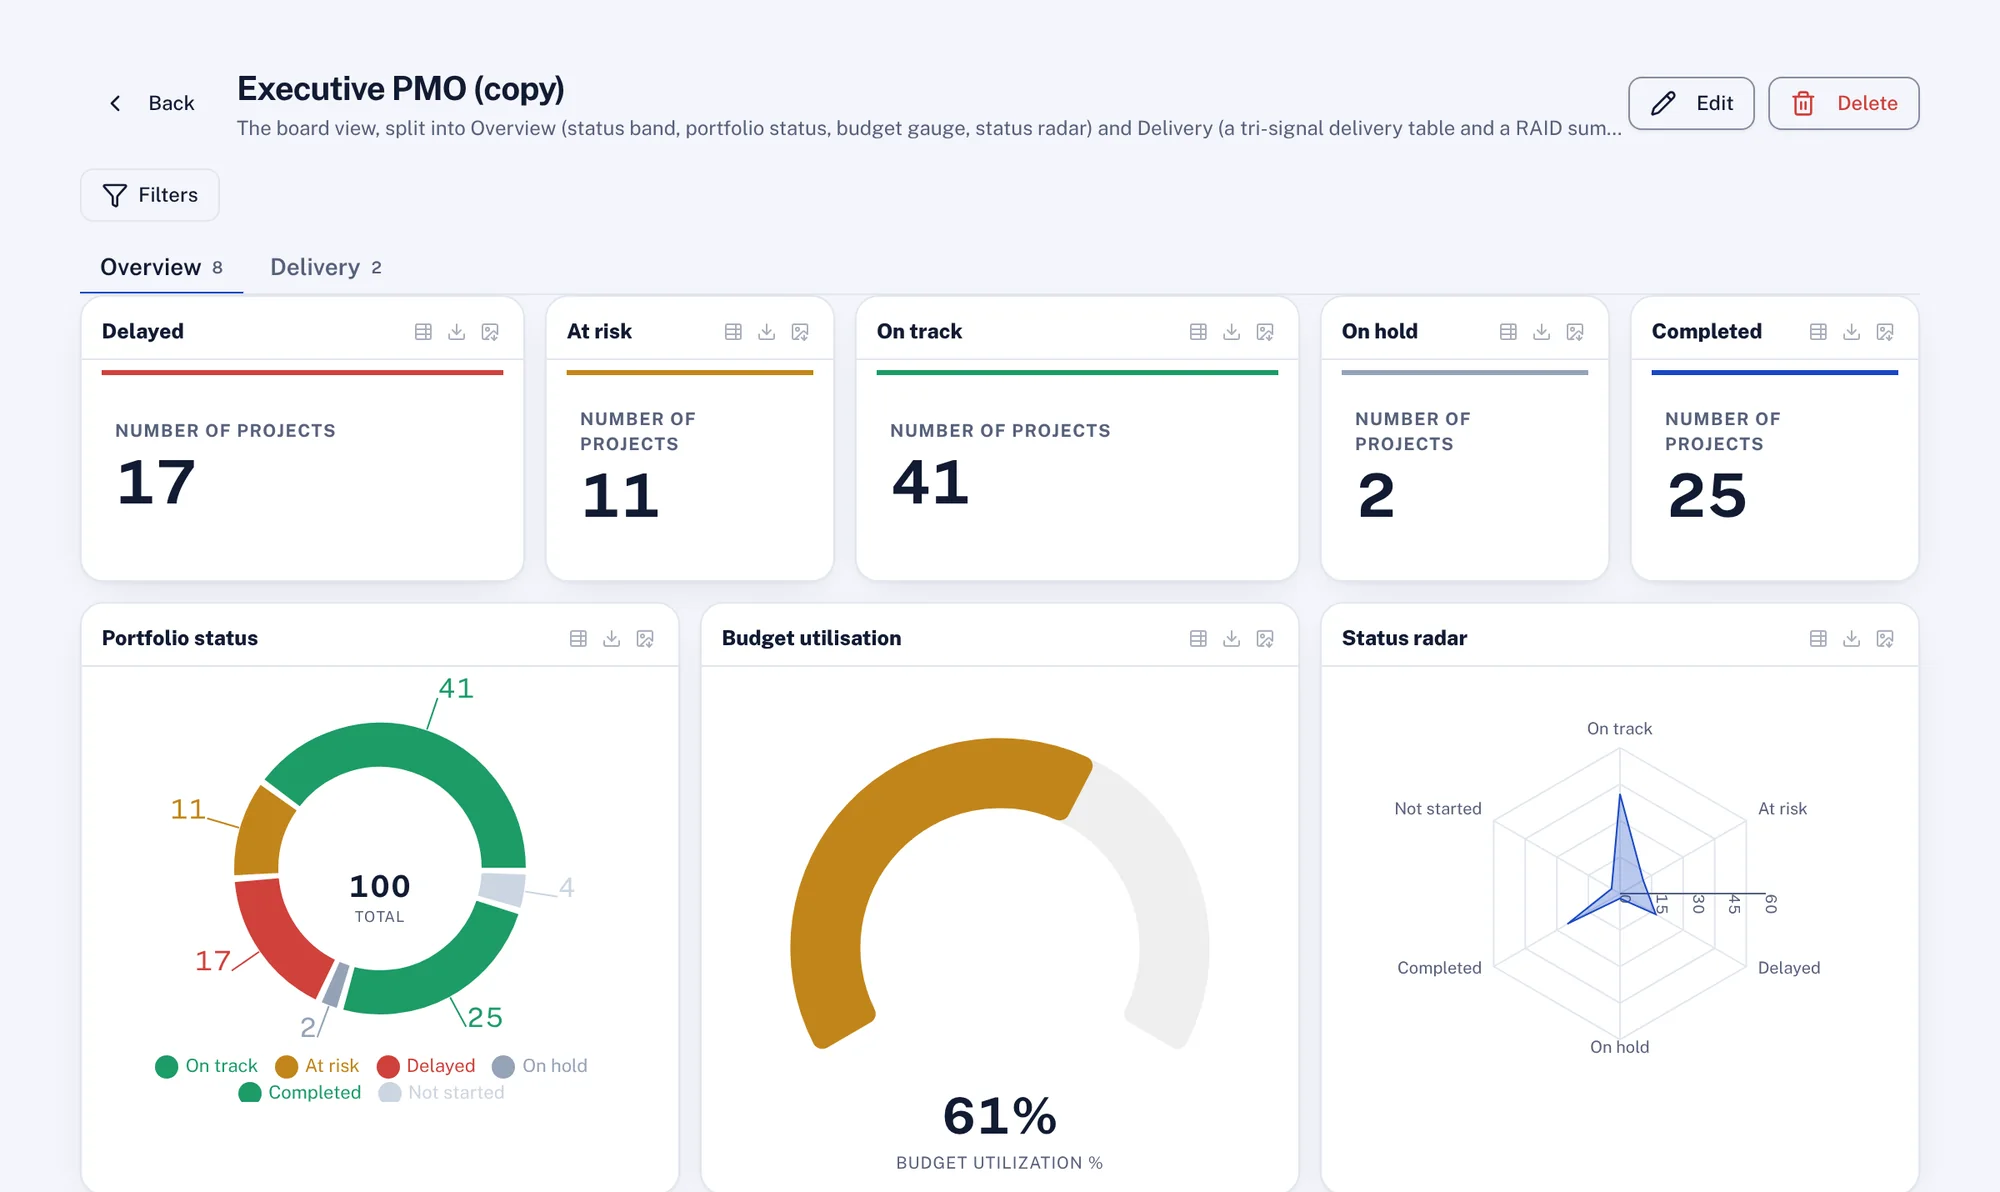
    Executive dashboard with project status counts, portfolio status donut, budget gauge and status radar
    Executive dashboard. Built from a template on the live numbers.

    What usually goes wrong

    And what changes when it runs on one model.

    01

    The pack takes a week

    Someone rebuilds the same slides every month.

    02

    Numbers disagree between decks

    Each forum gets a slightly different version.

    03

    Charts are pasted pictures

    They are out of date the moment they are pasted.

    04

    Arabic versions are an afterthought

    Translation happens the night before the meeting.

    Board reports that write themselves

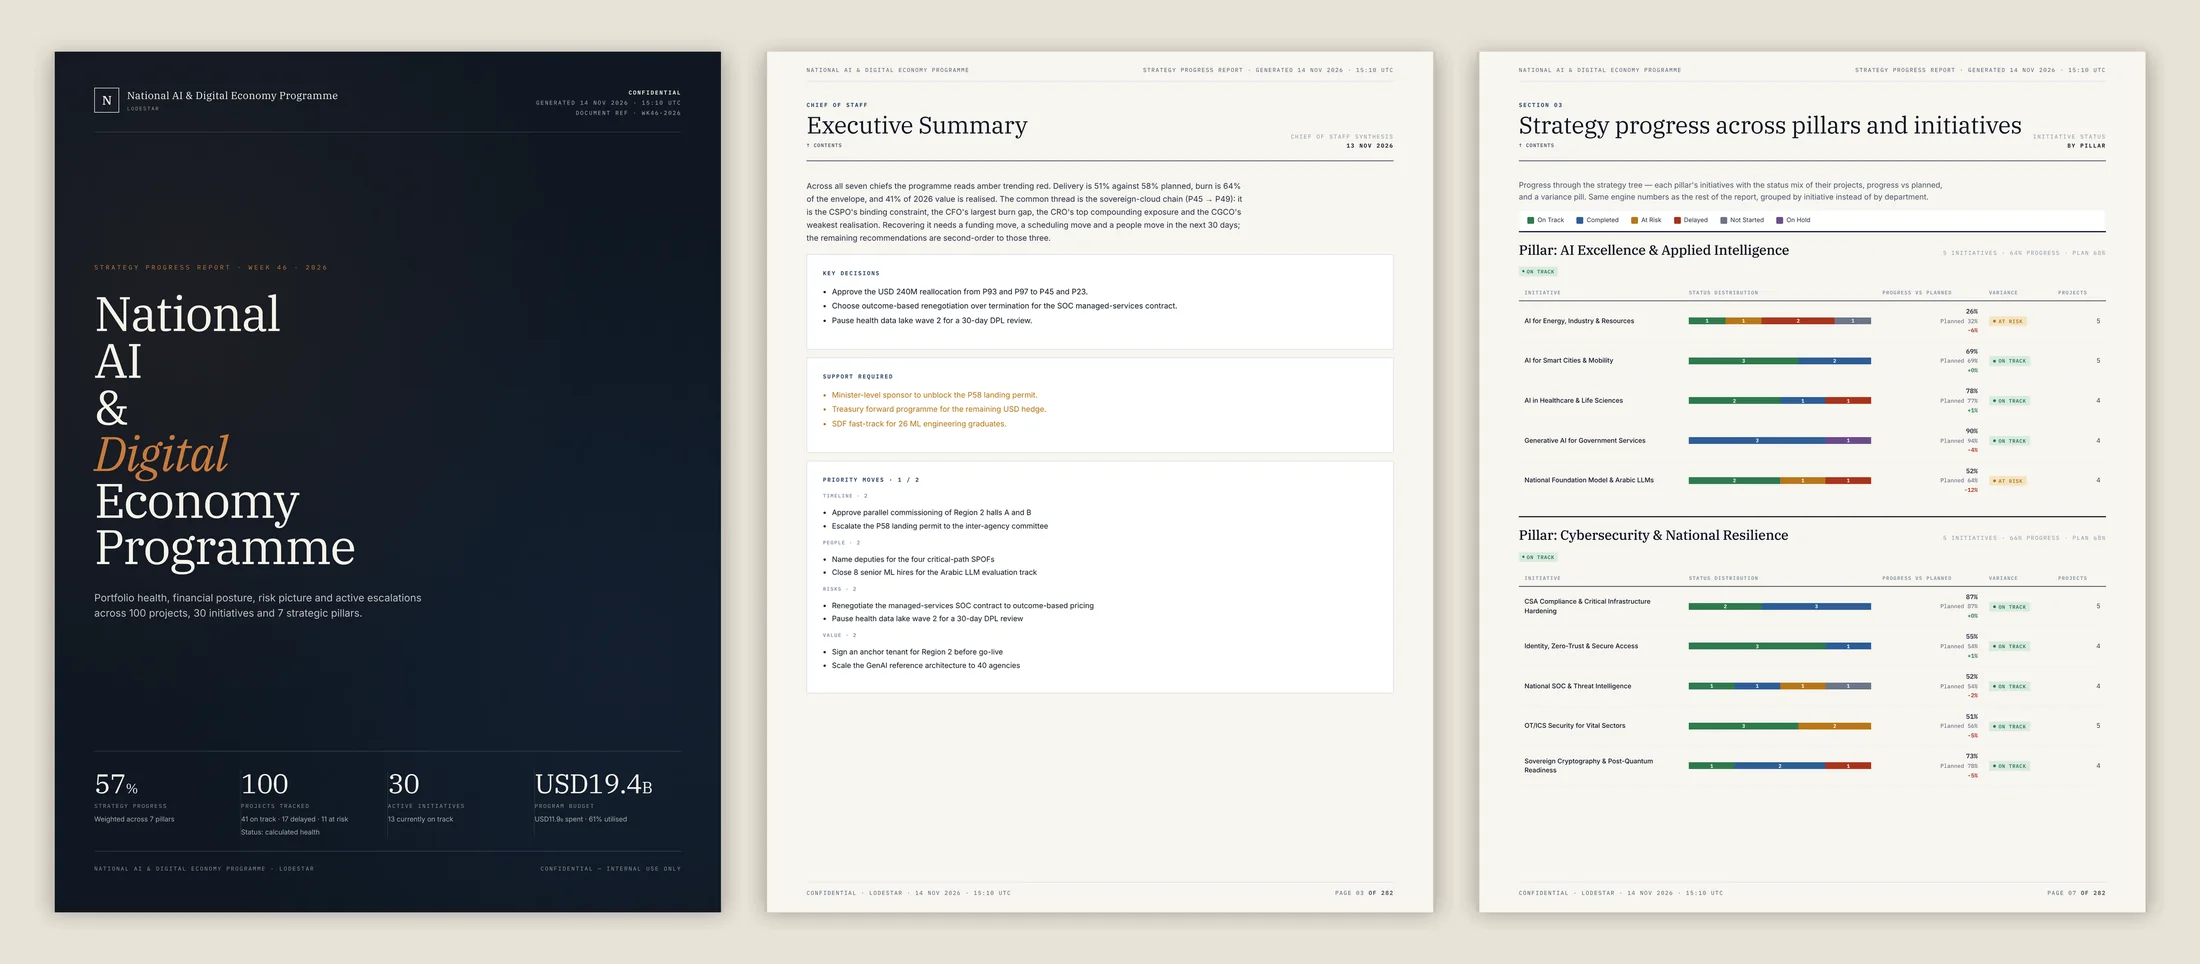
    Lodestar generates the strategy progress report for the board from the live model, structured the way top-tier strategy consulting firms write them: a cover with the headline numbers, an executive summary with the decisions owed, the programme overview, strategy progress across every pillar and initiative, a page per initiative, budget, risks and escalations. The template is tailored to your company.
    • Generated automatically from the live numbers
    • Built on top-tier strategy consulting practice
    • Templates tailored to your company
    Three pages of a generated strategy progress report: the cover with programme progress, projects, initiatives and budget; the executive summary with key decisions, support required and priority moves; and strategy progress across pillars and initiatives
    Strategy progress report. Cover, executive summary and strategy progress across pillars, generated by the app from the live model.

    The same report, as a PowerPoint deck

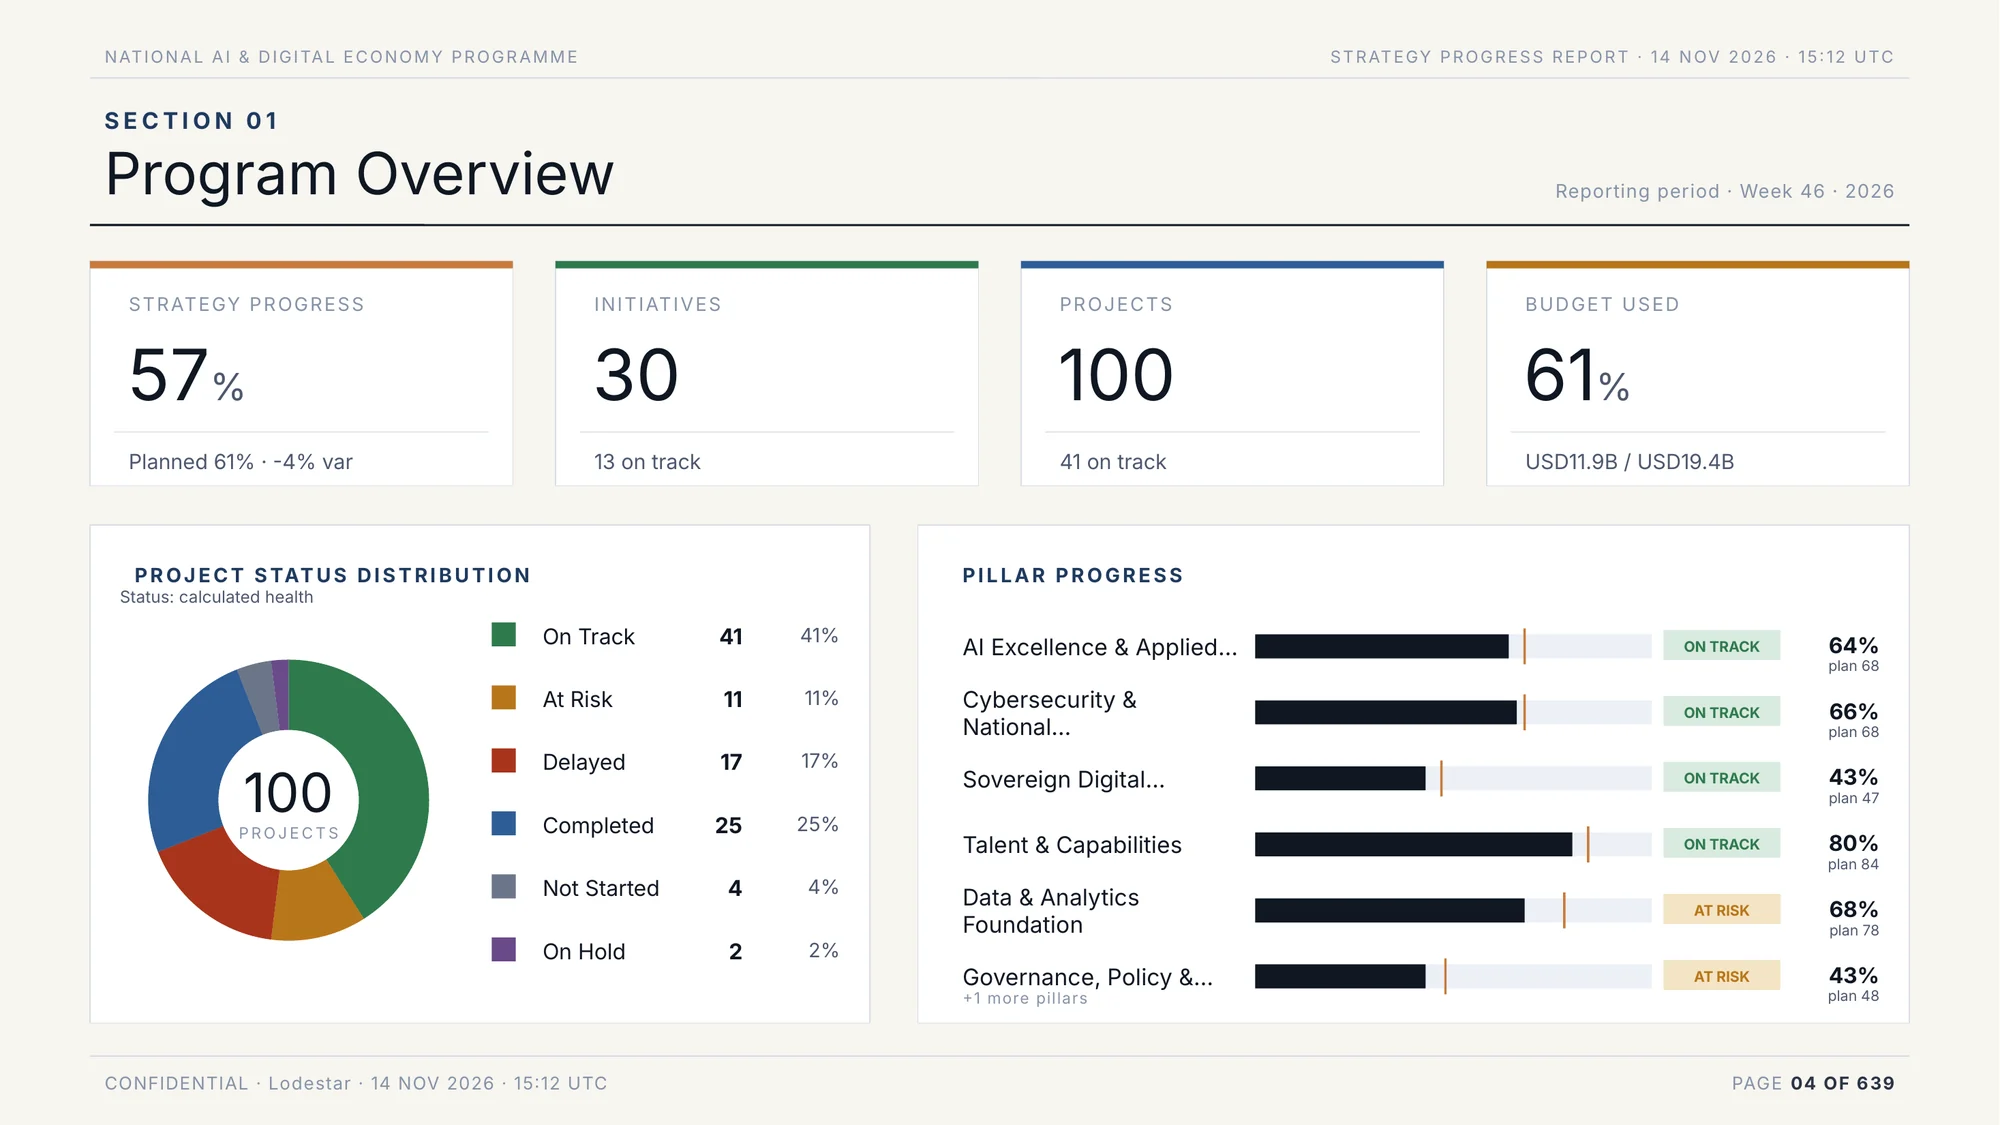
    Every report also exports to PowerPoint, slide for slide, so the board pack can go out as a deck. The slides are editable, not pictures, and follow your company template. PDF and Word are there too.
    • Editable slides, not pictures
    • Your company template
    • PDF and Word as well
    Program Overview slide from the exported PowerPoint deck: strategy progress, initiatives, projects and budget used, the project status distribution and progress by pillar against plan
    Program Overview slide. Slide 4 of the deck the app exports, shown in full.

    A KPI scorecard the board can read

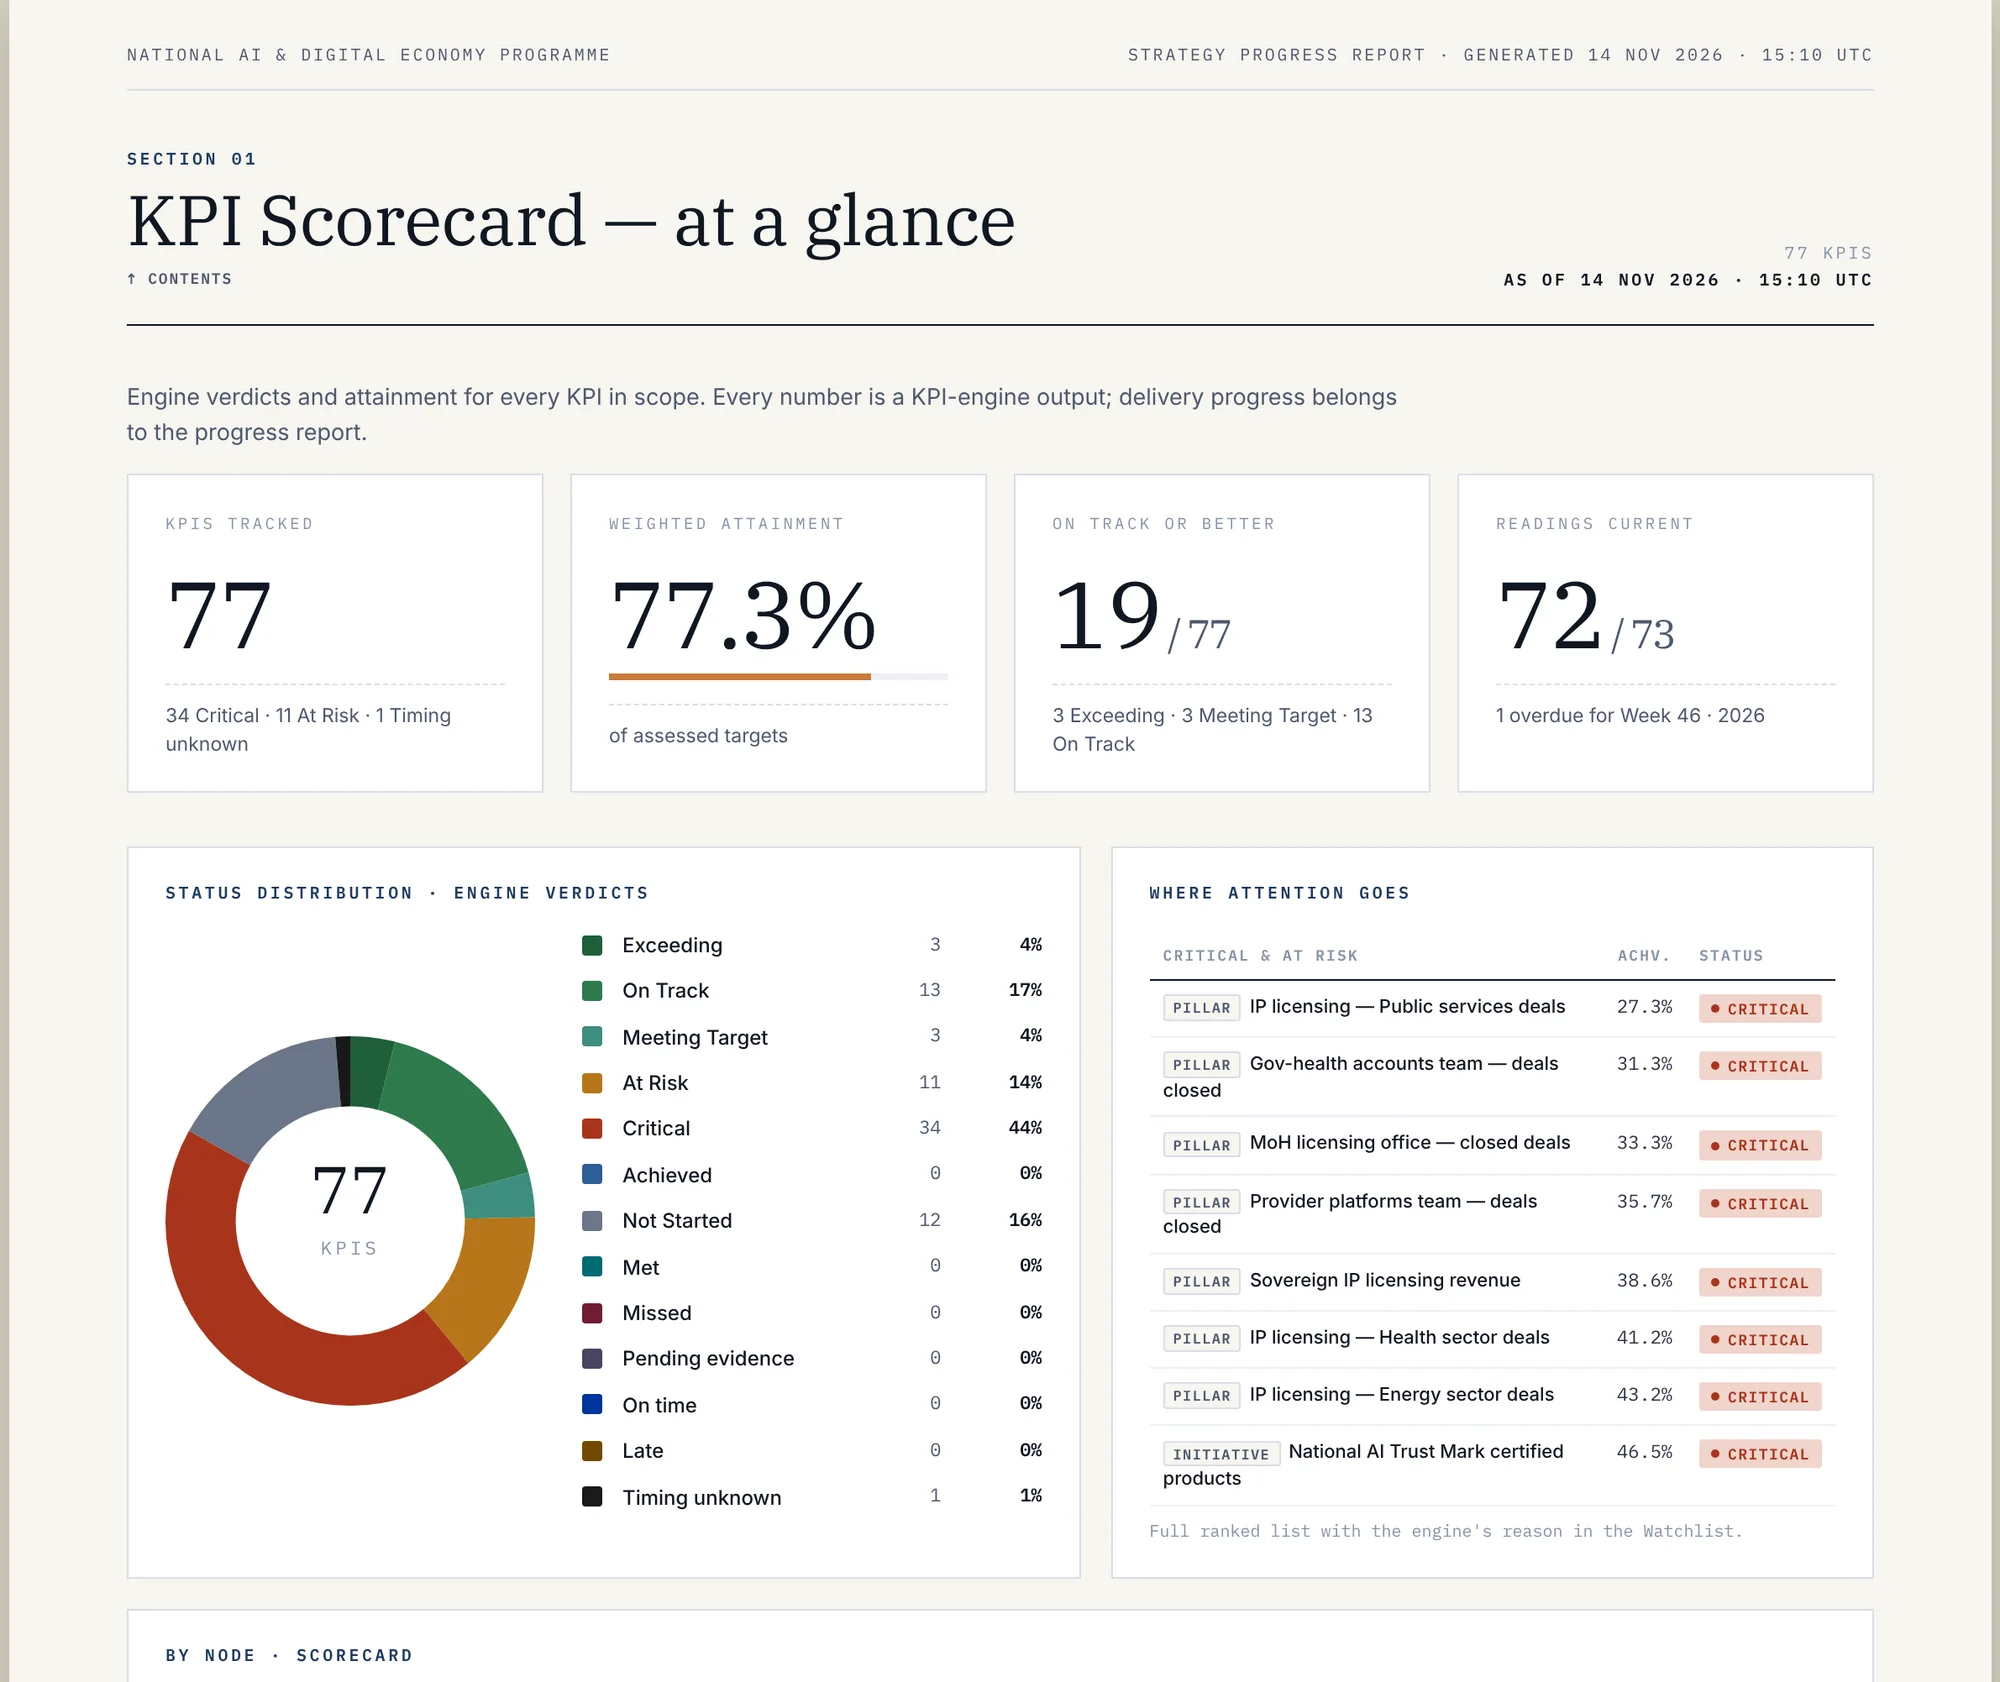
    The KPI scorecard opens with every KPI at a glance: how many are tracked, the weighted attainment, how many are on track and how many readings are current, the status distribution and where attention should go. A page per pillar and a card per KPI follow, each with the reason for its status and the evidence behind every reading.
    • Every KPI at a glance, with the engine's verdict
    • Where attention goes, ranked
    • A page per pillar and a card per KPI
    Generated KPI scorecard, at a glance: KPIs tracked, weighted attainment, on track or better and readings current, the status distribution and the KPIs where attention goes
    KPI Scorecard, at a glance. The first page of the generated KPI scorecard report.

    A one-page deep dive for every project

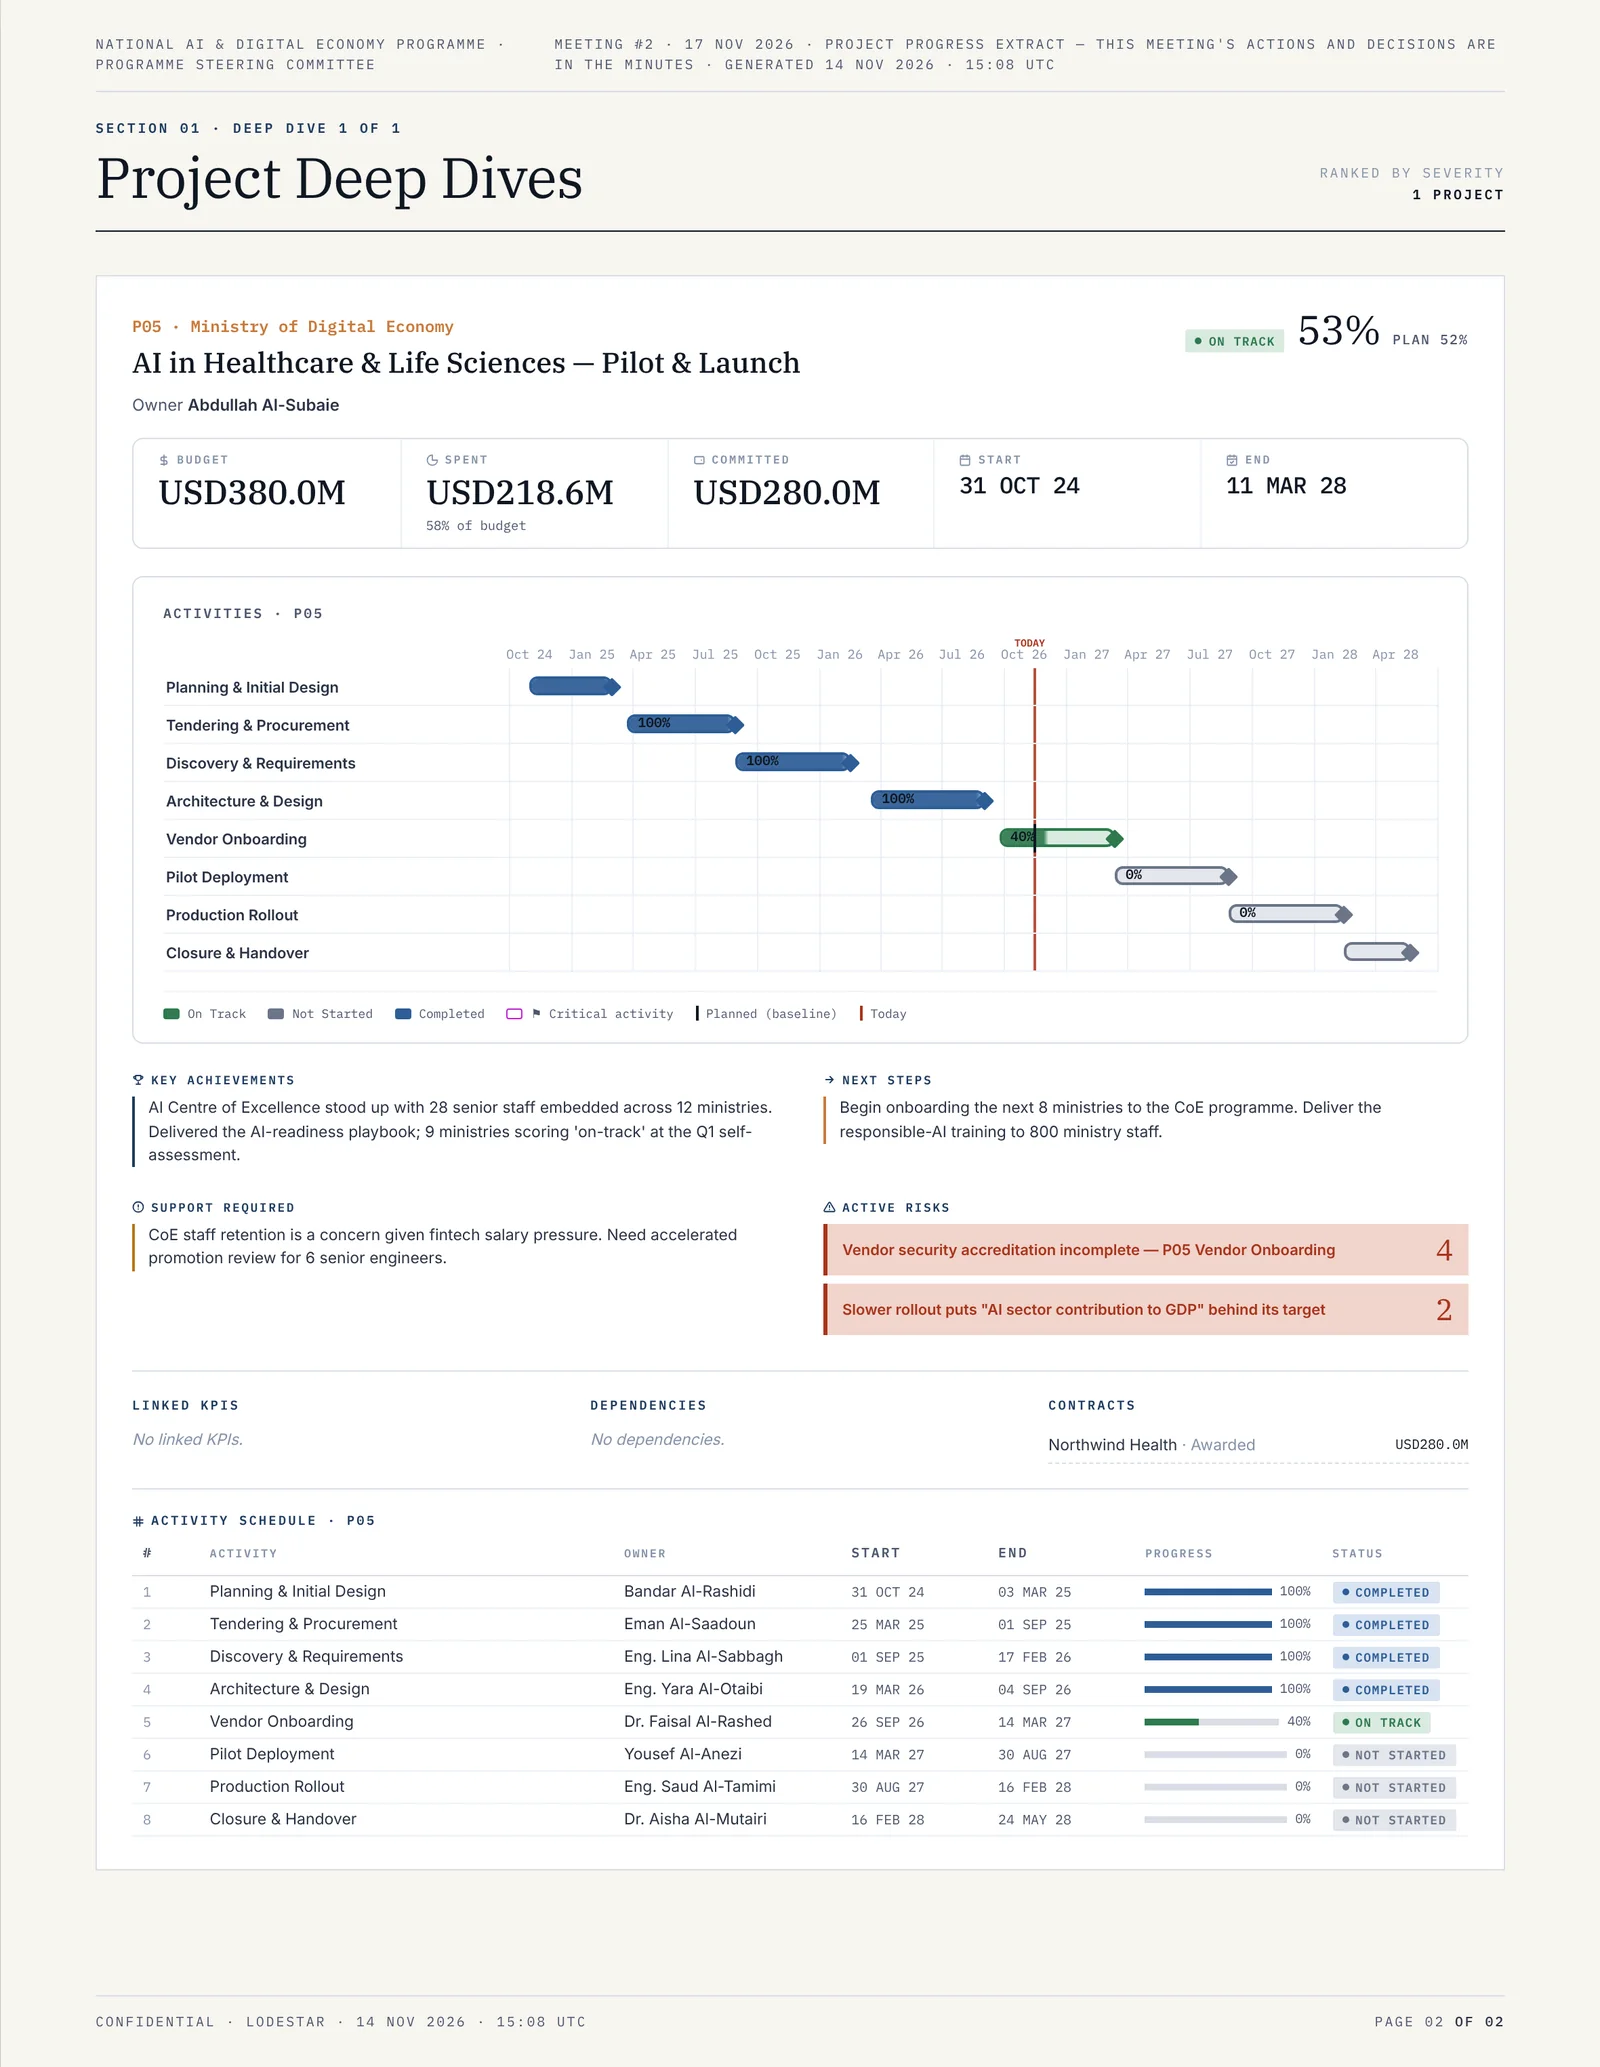
    For the steering committee, each project gets one page: budget, spent and committed, the activity Gantt against today, key achievements, next steps, support required, active risks, linked KPIs, dependencies, contracts and the activity schedule. It opens from the meeting it serves, for one project or every project on the agenda.
    • One page per project, for every project in the pack
    • Opened from the meeting it serves
    • PDF and PowerPoint export
    A full generated project deep dive page: project status and progress against plan, budget, spent and committed, start and end, the activity Gantt with today, key achievements, next steps, support required, active risks, linked KPIs, dependencies, contracts and the activity schedule
    Project deep dive. One full page, as the app generates it from the meeting host for the steering committee.

    Custom dashboards, built by you

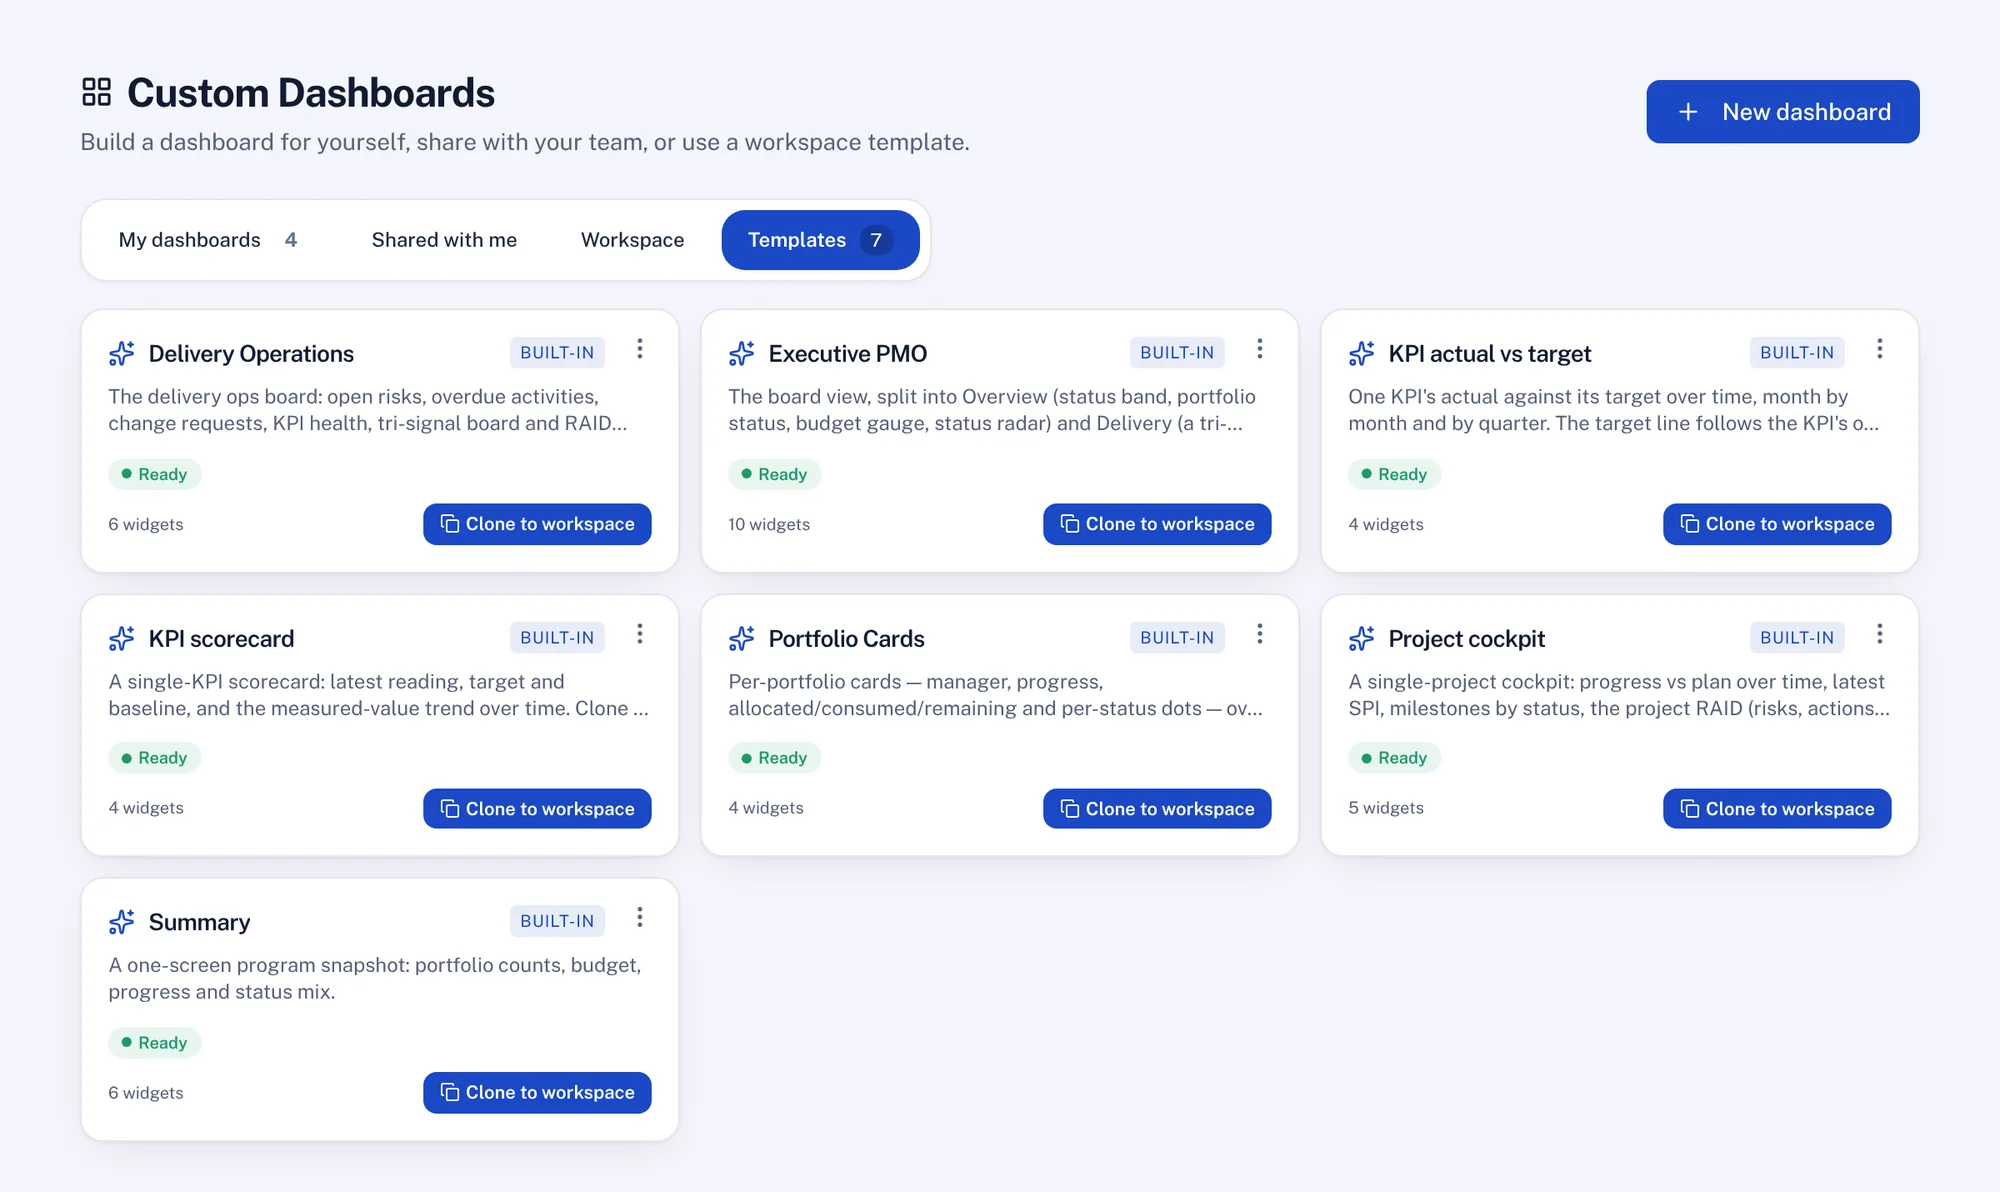
    Build a dashboard for yourself, share it with your team, or publish it to the whole workspace. Start from seven built-in templates, such as the executive PMO board, KPI actual against target or the project cockpit, or start blank and add the widgets you need. Every widget reads the live model.
    • Your own, shared and workspace dashboards
    • Seven templates to clone and adjust
    • Filters by department, pillar and status
    Custom dashboards: my dashboards, shared, workspace and seven built-in templates
    Start from seven templates, or build your own
    Executive PMO dashboard cloned from a template: projects by status, portfolio status donut, budget utilisation gauge and status radar
    Executive PMO: status, budget and portfolio at a glance
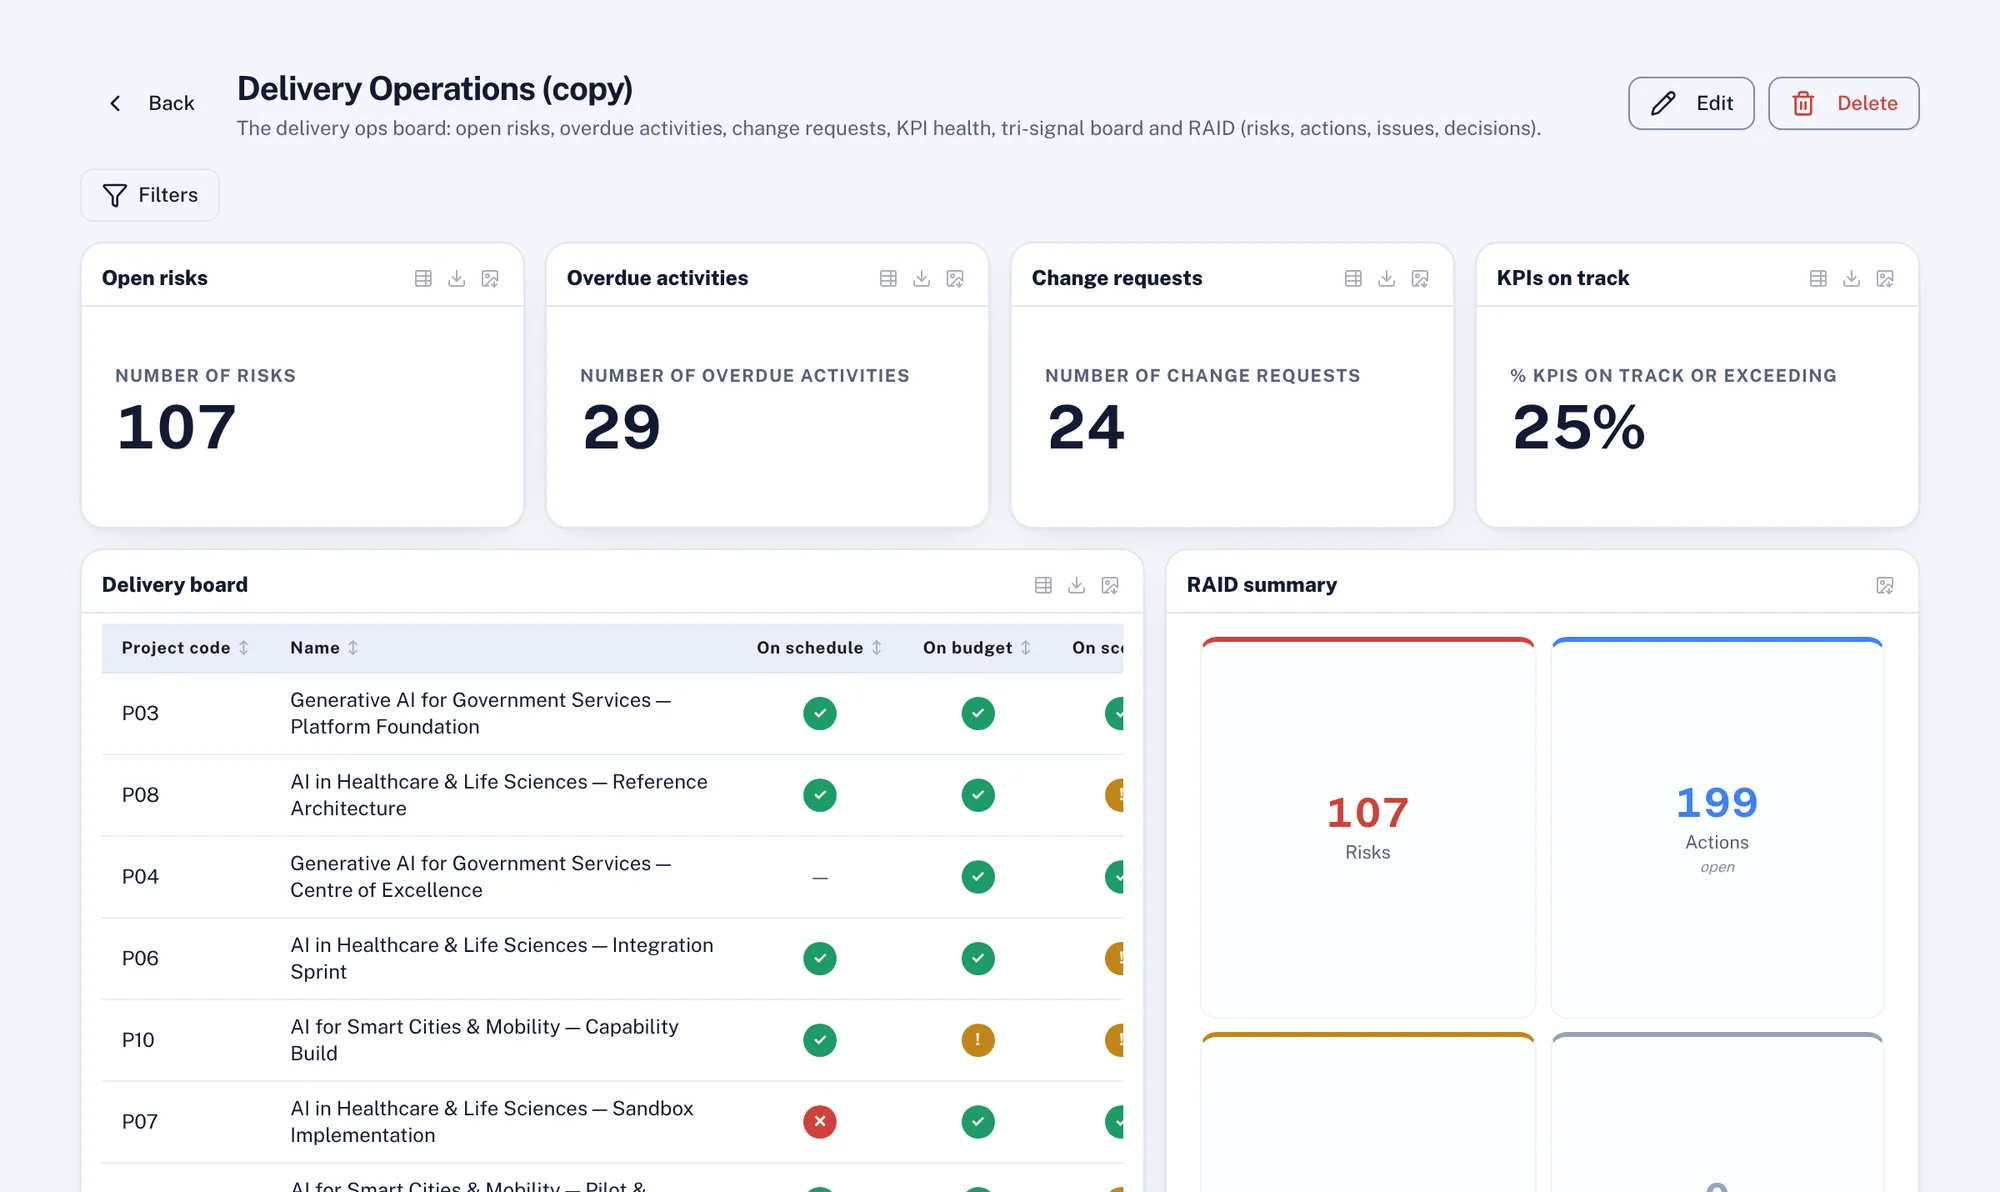
    Delivery operations dashboard: open risks, overdue activities, change requests, KPIs on track, a delivery board and a RAID summary
    Delivery operations: risks, overdue work and the delivery board
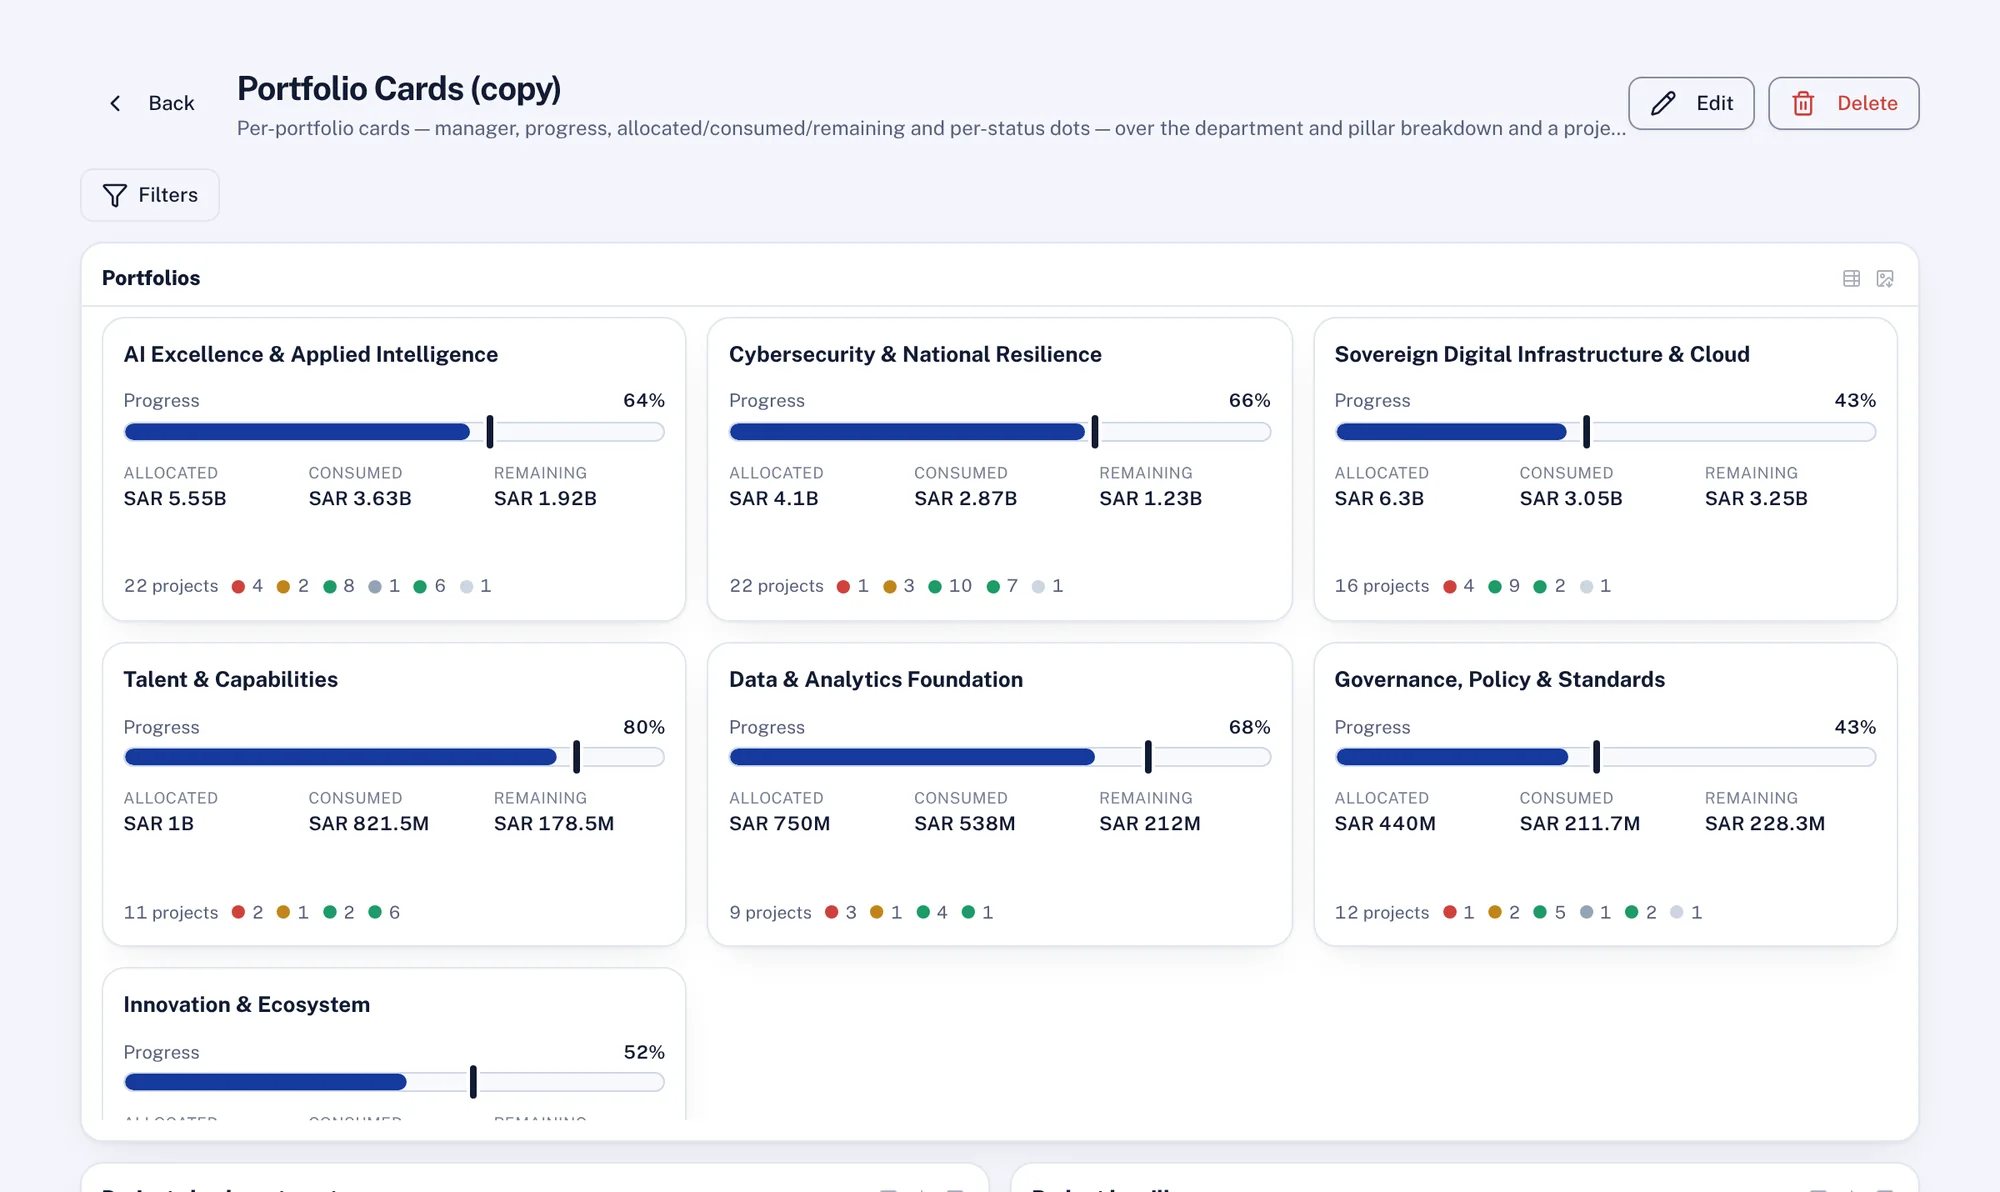
    Portfolio cards dashboard: progress, allocated, consumed and remaining budget and status mix for each portfolio
    Portfolio cards: progress and money for every portfolio
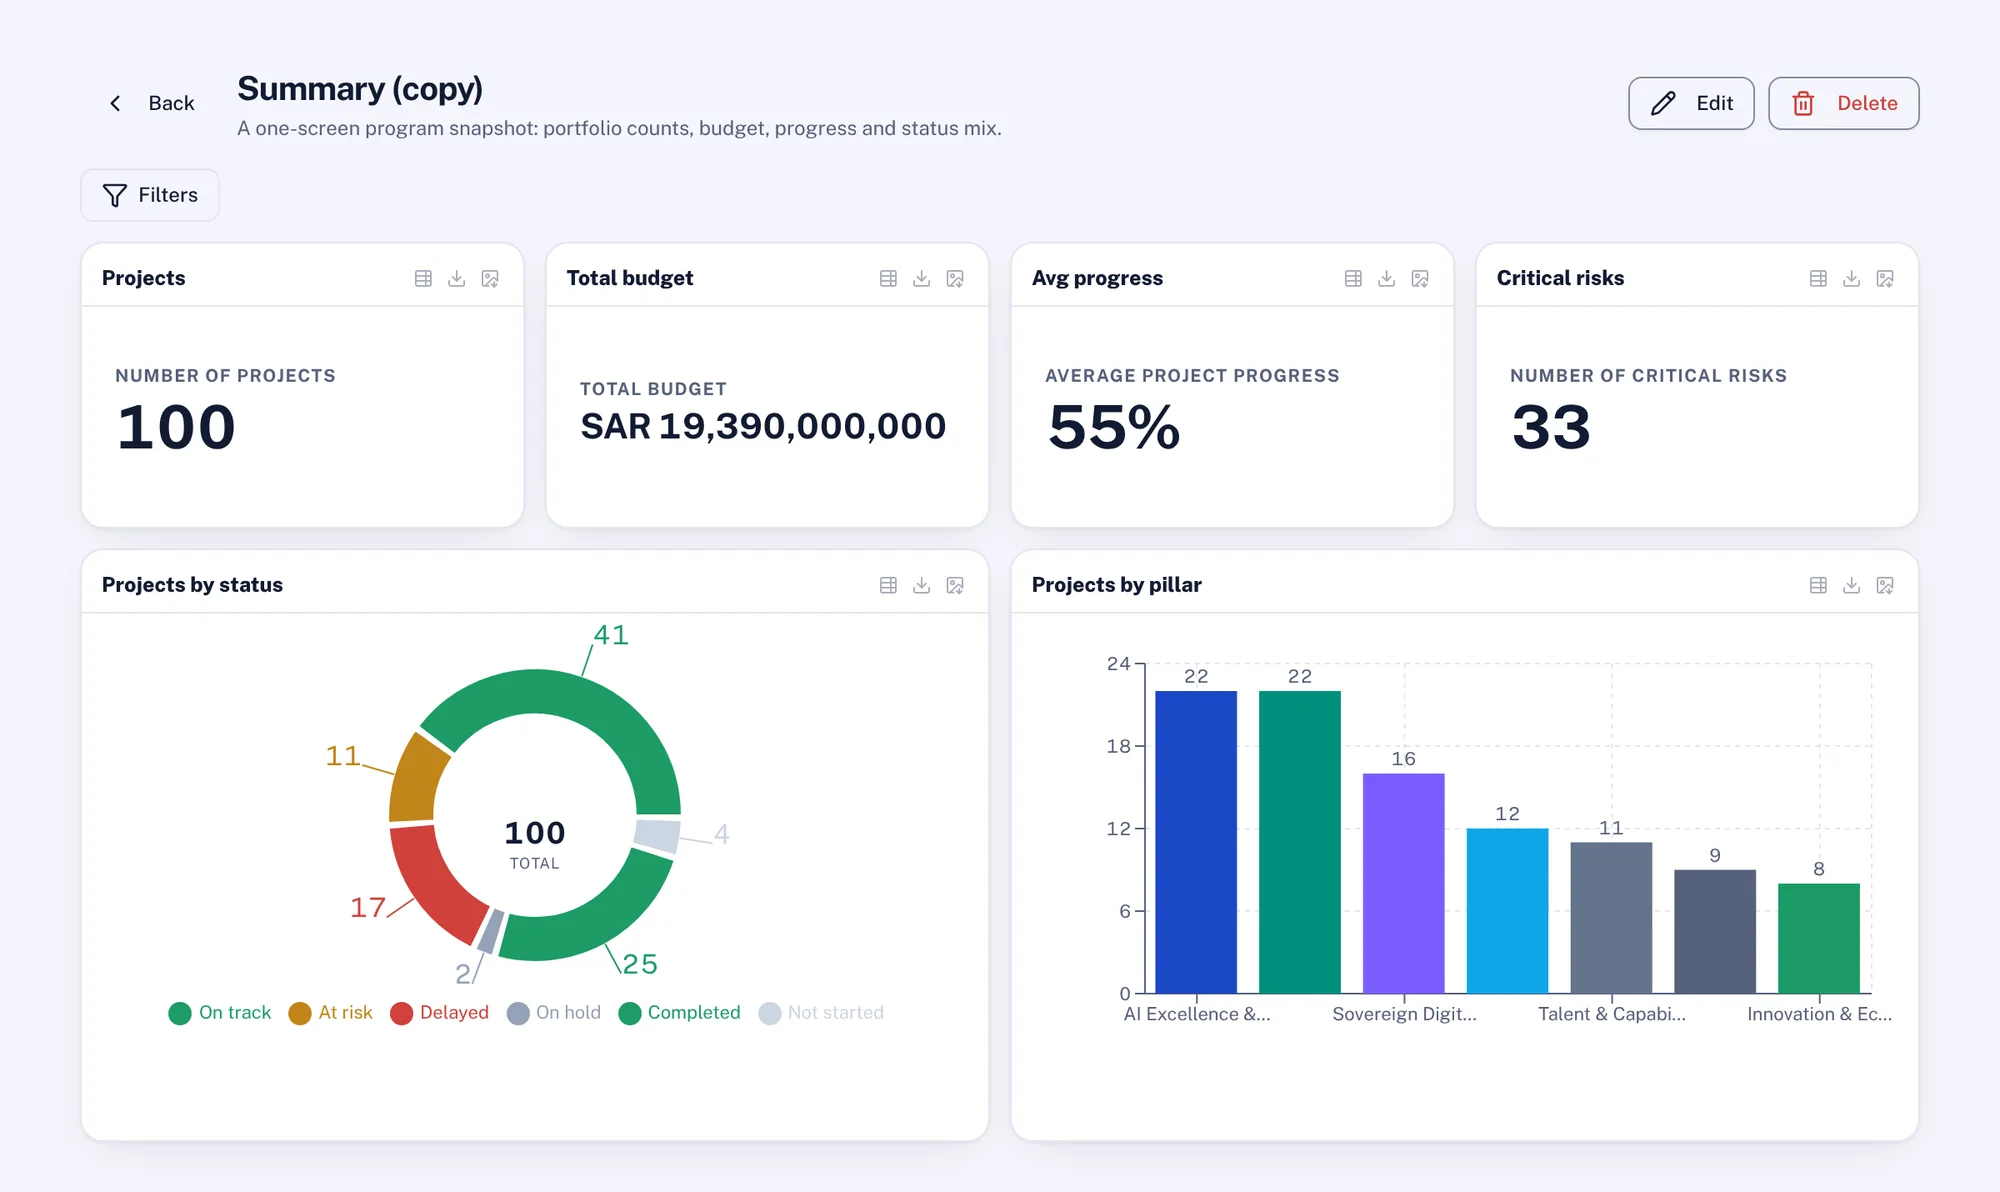
    Summary dashboard: number of projects, total budget, average progress, critical risks, projects by status and by pillar
    Summary: the programme on one screen
    Custom dashboards. Swipe through the templates and four dashboards built from them, captured from the app.

    A department report on one page

    Projects, progress against plan, budget, status and lifecycle for any department or portfolio, with exports built in.
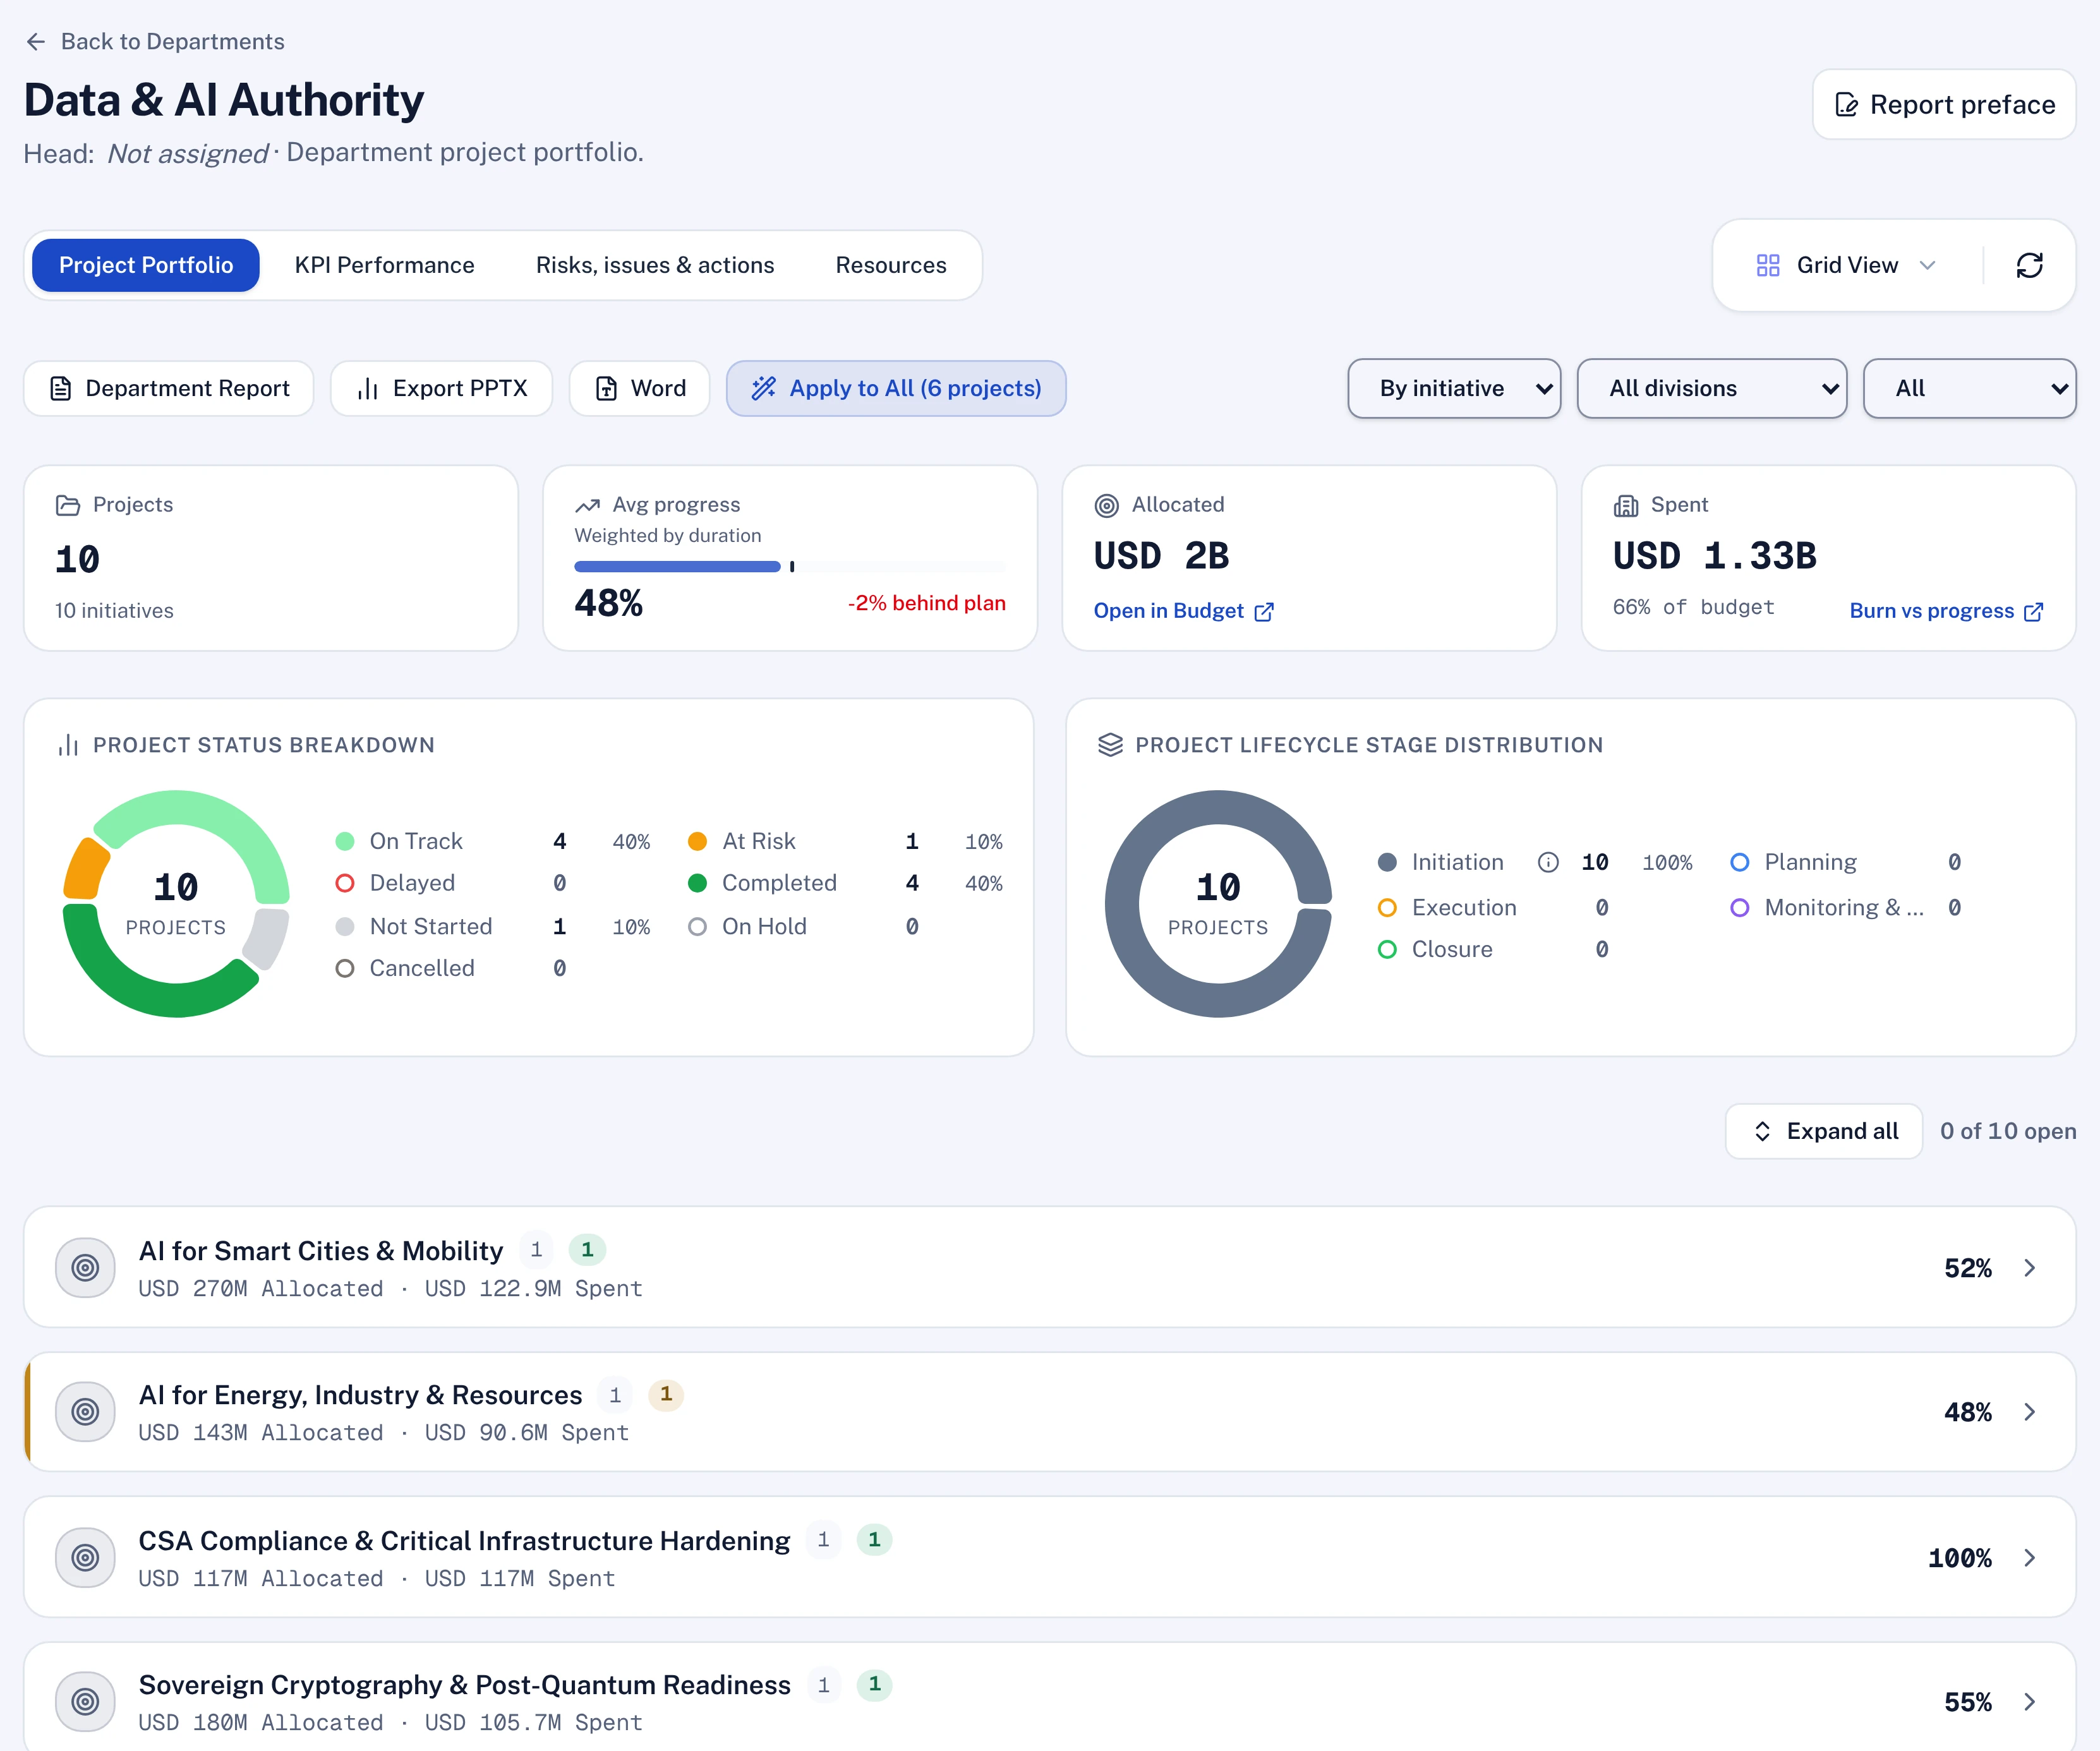
    • PDF, PowerPoint and Word
    • Report preface for the forum
    • Applies to every project in the portfolio
    Department portfolio page with export buttons, progress, budget and status
    Department report. Exports from the same page.

    What you get

    Every item runs on the same engines the screens use.

    Templates

    Board, portfolio, programme and project templates.

    Four formats

    PDF, PowerPoint, Word and HTML.

    Arabic and English

    Reports in both languages from the same model.

    Report Studio

    Custom reports outlined and reviewed with Polaris.

    Distribution

    Reports sent on a schedule to each forum.

    Live charts

    Bound to their records, so the pack refreshes.

    Polaris in reports and dashboards

    The advisors and agents that work in this part of the platform. All agents

    Report Studio agent

    Watches and drafts

    Outlines and reviews custom reports and builds board packs from a conversation or a comparison.

    Reads
    The live model, your template
    Produces
    Reports and board packs

    Translation

    Watches and drafts

    Translates stored briefs and reports so leadership can read them in Arabic.

    Reads
    Briefs and reports
    Produces
    Arabic versions, cached

    Key takeaways

    Watches and drafts

    Drafts the key takeaways for an initiative or pillar for its owner to edit.

    Reads
    The initiative or pillar
    Produces
    A draft for the owner

    Questions

    Can the board pack use our own template?

    Yes. Give Polaris your template and it builds the pack in it, from the same numbers as the dashboards.

    Are board reports generated automatically?

    Yes. The strategy progress report, the KPI scorecard and the one-page project deep dives are generated from the live model, structured the way top-tier strategy consulting firms write board reports, in a template tailored to your company.

    Can we build our own dashboards?

    Yes. Each person can build a dashboard for themselves, share it with their team or publish it to the workspace, from scratch or from one of seven built-in templates.

    Are reports available in Arabic?

    Yes. Reports are produced in Arabic and English, and the whole interface runs right to left.

    See it on your own programme.

    Send us a slice of your portfolio and we load it before the session, from strategy down to task.